Knowledge Centre
Time for Small Caps?
June 2023
Since 1957 Canadian large cap stocks have generated an average annual total return of 9.9%. Over the same time period, Canadian small cap stocks earned an average annual total return of 14.0%. Everything else being equal, the obvious conclusion is that investors should overwhelmingly be invested in small cap stocks. Unfortunately, everything else is not equal, not by a long shot. The downside to small cap stocks is volatility, as they carry the greatest risk and have the widest range of performance. In fact, small cap stock performance is 50% more volatile than that of large cap stocks.
The returns mentioned above have been heavily enhanced by performance results prior to 2003. Over the past 20 years large cap Canadian stocks have actually slightly outperformed smaller cap stocks, 9.7% per year versus 9.1%, respectively. During this time period, the volatility of small cap stocks compared to large cap stocks has remained consistent with earlier years. So, not only were small caps not generating superior returns for the past two decades, but they have also been much riskier. This is not a winning combination.
Fortunately, there is a distinct period when the level of small cap outperformance is so powerful that the returns outweigh the risks. Historical data suggests small cap companies tend to underperform large cap peers when economic activity contracts. Economic uncertainty and fears of recession lead to more defensive posturing. With uncertainty, investors migrate to safety and seek out large cap stocks. In recent years, this has been further exacerbated by the increasing concentration of a handful of technology stocks in the U.S., such as Microsoft, Amazon, and Alphabet, and a select handful of banks, energy companies and railway firms in Canada. In fact, the 10 largest stocks in the S&P 500 make up 30.4% of the index while in Canada, they account for 35.0% of the index.
The stock market’s leadership has become extremely narrow, meaning only a small number of stocks are outperforming and contributing to the market advance. This is clearly extreme and probably unwarranted, especially since small cap stocks historically have a slight premium valuation to large cap stocks but are now priced at a discount of roughly 30% relative to their larger counterparts, a multi-decade low. This combination of circumstances tends to coincide with the beginning of very strong secular markets for small caps to outperform large cap stocks.
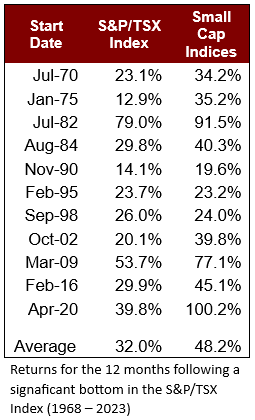
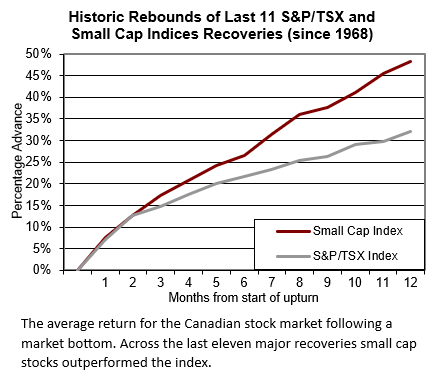
From a Canadian perspective, we looked at market return data to see how Canadian Small Cap equities performed after the market has bottomed and a financial market recovery is underway. Using month end data, we reviewed the 11 most significant rallies in the S&P/TSX from 1968 to date and found the S&P/TSX Index returned 32.0% in the 12 months following the market bottom; however, the BMO Small Cap Index (prior to 2010) and the S&P/TSX Small Cap Index (since 2010) performed even better, delivering 48.2% over the same period. This 50% outperformance is highly significant and clearly indicates the value small caps can bring to a portfolio when used appropriately.
It is impossible to predict the stock market bottom for the current economic downturn. However, many market commentators believe we may have already reached the bottom in October 2022. The results since this date have not been anywhere close to historic recovery gains, with the S&P/TSX Index returning 7.5% so far; and the S&P/TSX Small Cap Index gaining 7.4%. So, there is a way to go. Eventually confidence in the markets will be restored and could be in for a meaningful surge.
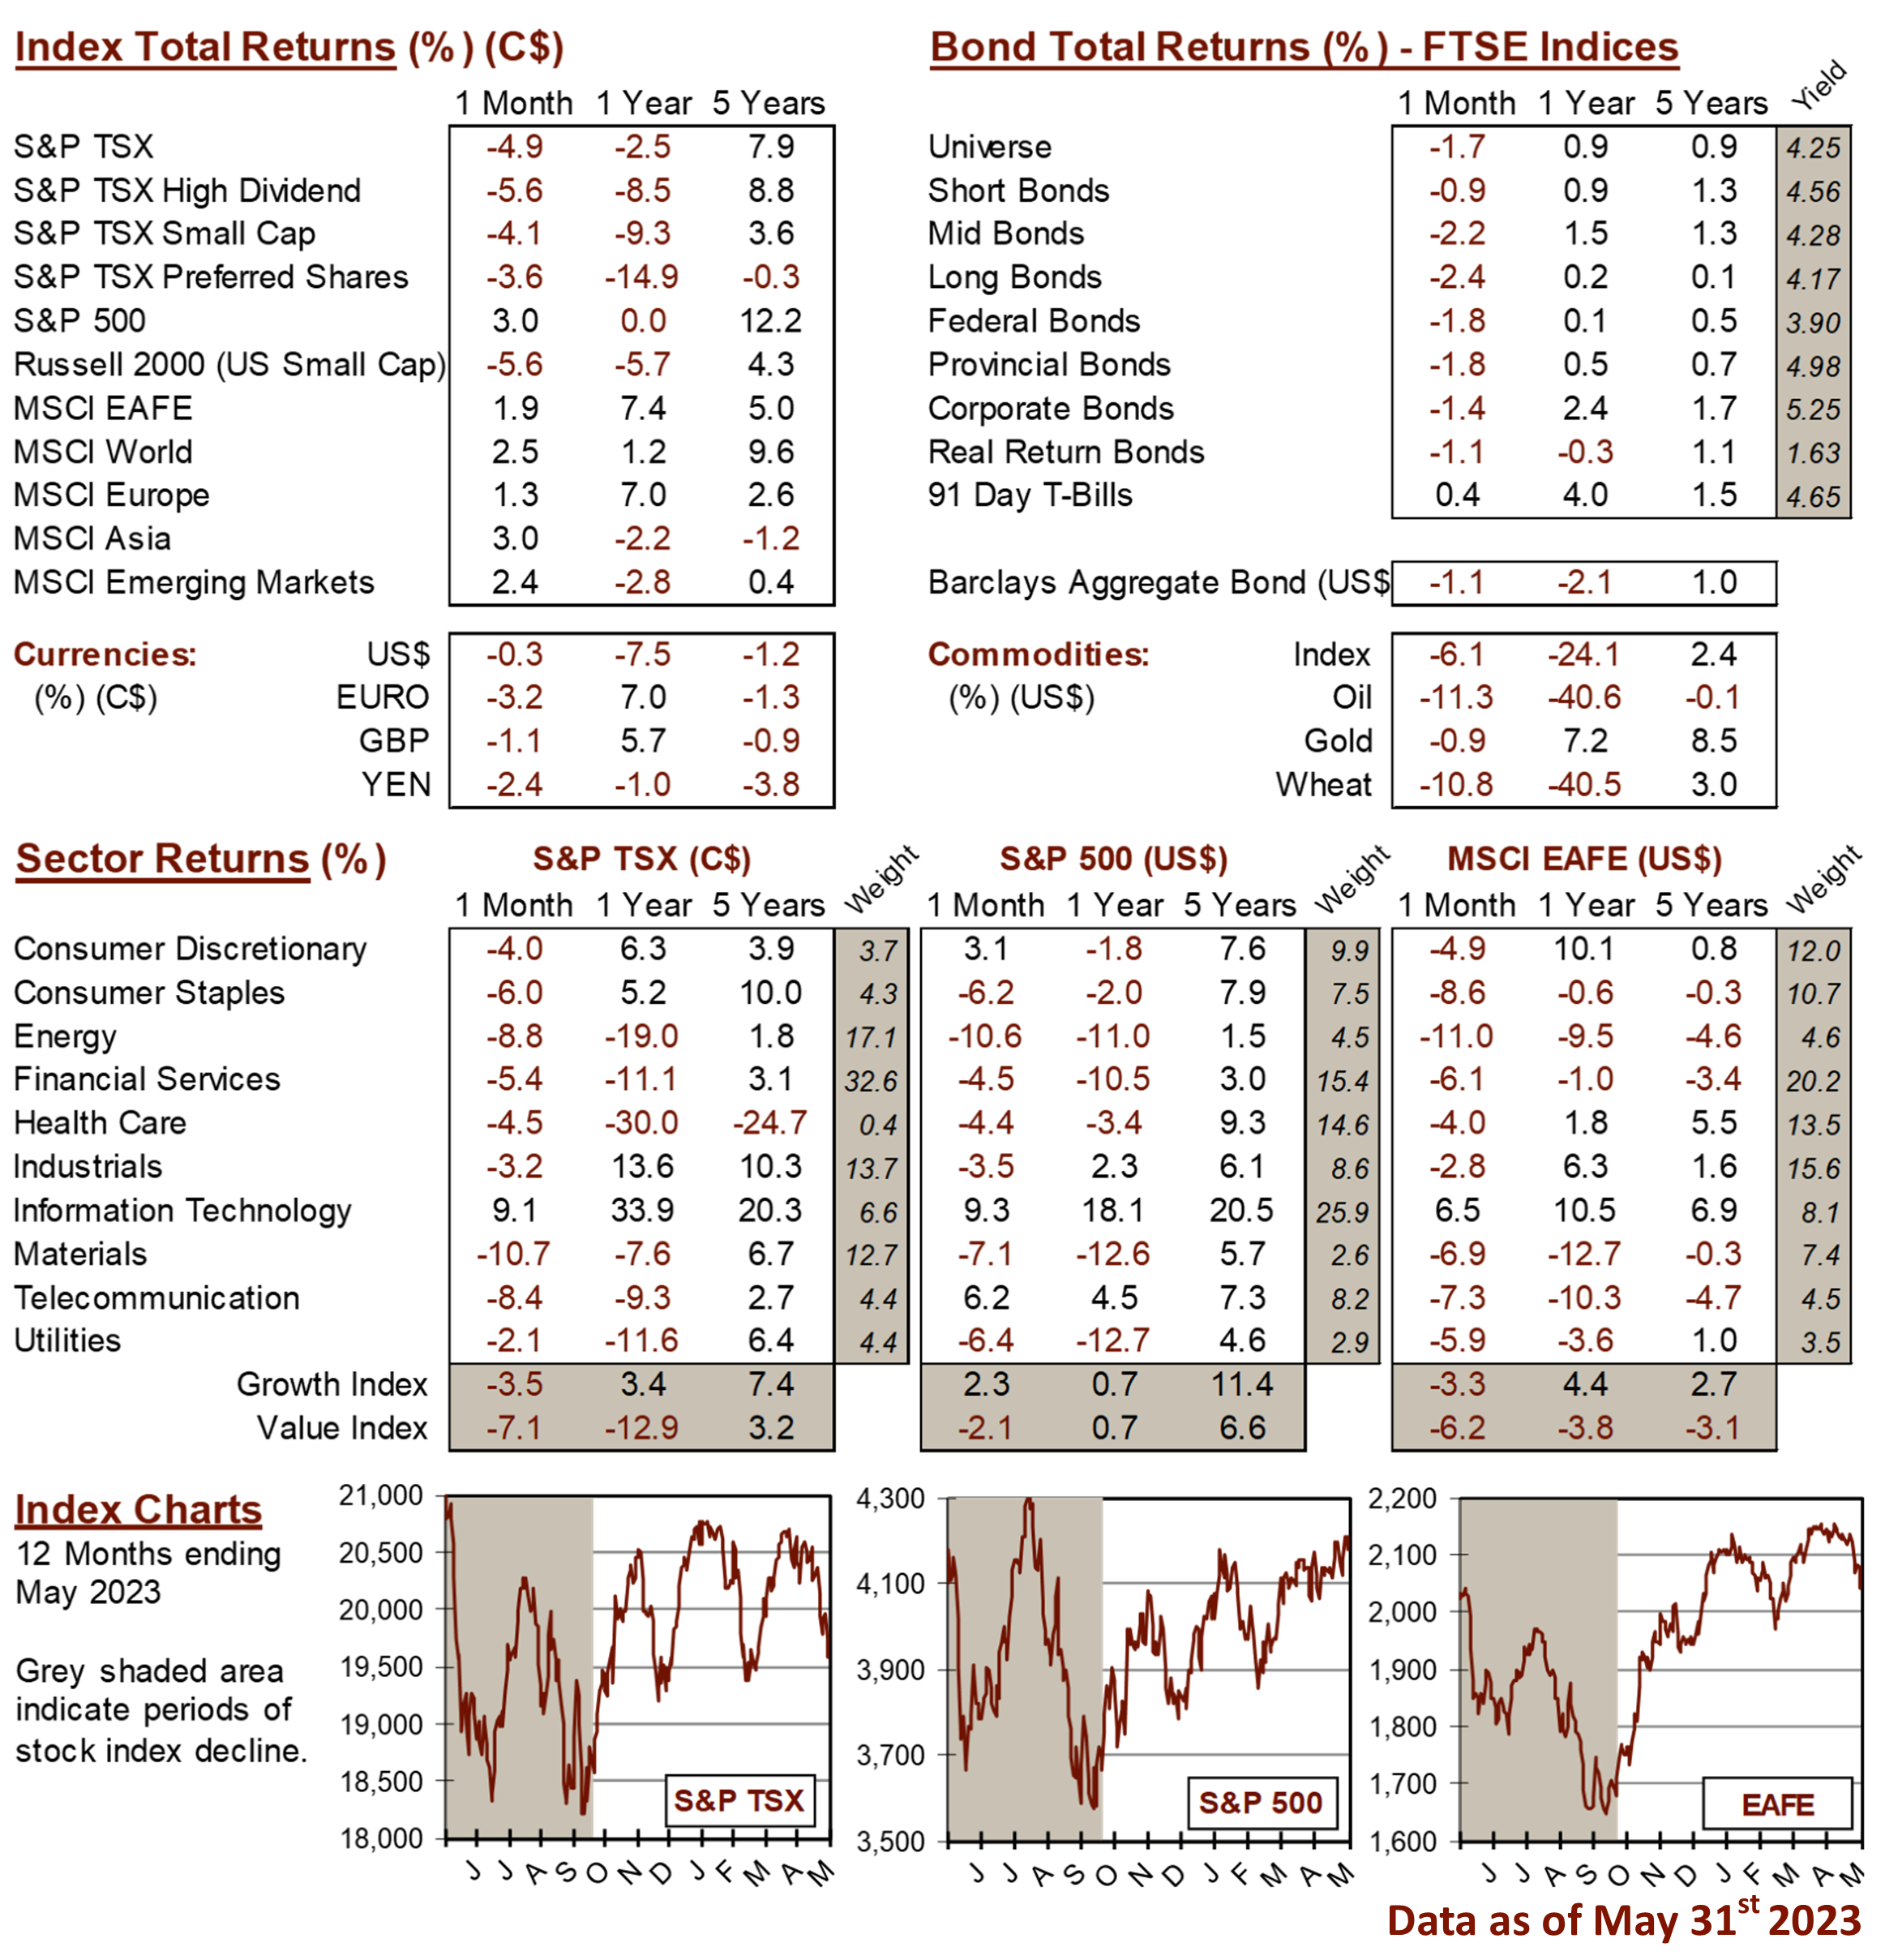
MARKET DATA
This report may contain forward looking statements. Forward looking statements are not guarantees of future performance as actual events and results could differ materially from those expressed or implied. The information in this publication does not constitute investment advice by Provisus Wealth Management Limited and is provided for informational purposes only and therefore is not an offer to buy or sell securities. Past performance may not be indicative of future results. While every effort has been made to ensure the correctness of the numbers and data presented, Provisus Wealth Management does not warrant the accuracy of the data in this publication. This publication is for informational purposes only.
Contact Us
18 King St. East Suite 303
Toronto, ON
M5C 1C4