Knowledge Centre
The Other January Effect
January 2021
Most investors have heard of the January Effect which is the observation that January has historically been the best month to be invested in stocks. This is particularly true for U.S. small-cap stocks which have consistently recorded abnormally positive returns in the early weeks of the year. However, there is another January effect which states that “as goes January, so goes the year”. To find out if this effect was equally applicable to Canada we looked at 53 years of monthly equity market returns (excluding dividends) from 1968 to 2020 for the S&P/TSX as well as the S&P 500.
Most investors have heard of the January Effect which is the observation that January has historically been the best month to be invested in stocks. This is particularly true for U.S. small-cap stocks which have consistently recorded abnormally positive returns in the early weeks of the year. However, there is another January effect which states that “as goes January, so goes the year”. To find out if this effect was equally applicable to Canada we looked at 53 years of monthly equity market returns (excluding dividends) from 1968 to 2020 for the S&P/TSX as well as the S&P 500.
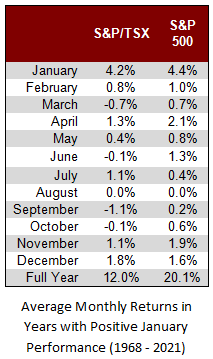
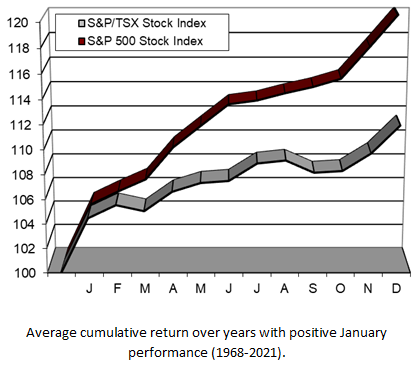
What we initially found striking is that when January had a positive return, those returns were well above average relative to the other months of the year. For example, of the 34 Januarys with positive performance, the S&P/TSX was up an average of 4.2%. The next best performing month in those years, as can be seen in the table to the left, was December which returned half that amount at 1.8%. Similarly in the U.S., the 31 Januarys with positive performance were up an average of 4.4% while the next best month was April with a 2.1% gain. The chart to the right depicts the average annual cumulative returns and it clearly shows that the opening month has the best performance relative to the remaining months of the year.
We then looked at how these markets performed for the full year. In those years where January was positive the S&P/TSX (excluding dividends) returned 12.0% versus an average of 10.3% for all 53 years reviewed, a 17% improvement, and the S&P 500 (excluding dividends) returned 20.1% versus an average of 11.8%, or 70% better. These numbers confirm that “as goes January, so goes the year” translating into above average annual performance in those years.
The most widely accepted explanation for the January Effect is tax-loss selling. The tax circumstances of taxable investors are often more important than a security’s fundamental valuation. This means that investors will sell whatever securities are required at the end of the calendar year to establish capital losses for income tax purposes and then repurchase the shares after a prescribed waiting period. As the waiting period most often expires early in the next year, the repurchase orders flood the market in January, hence creating abnormal returns in the month.
In addition to tax issues, researchers have also suggested other reasons for the January Effect. One is “window-dressing”, as portfolio managers unload their embarrassing stocks at year-end so that they don’t appear on their annual report, and then redeploy the proceeds in January. Another reason, which we may see more of in 2021, is short sellers covering their successful short positions early in the next year so they usually do not have to pay taxes on the gains until April of the following year.
Whatever the explanation, it is clear that investors should not be out of the market if January is a good month because the returns over the rest of the year, while not as robust, are usually positive.. Of course, one must always bear in mind that past performance does not mean this trend will continue. The debate over the January Effect will no doubt continue for many years to come and it will be interesting to see how it plays out in 2021.
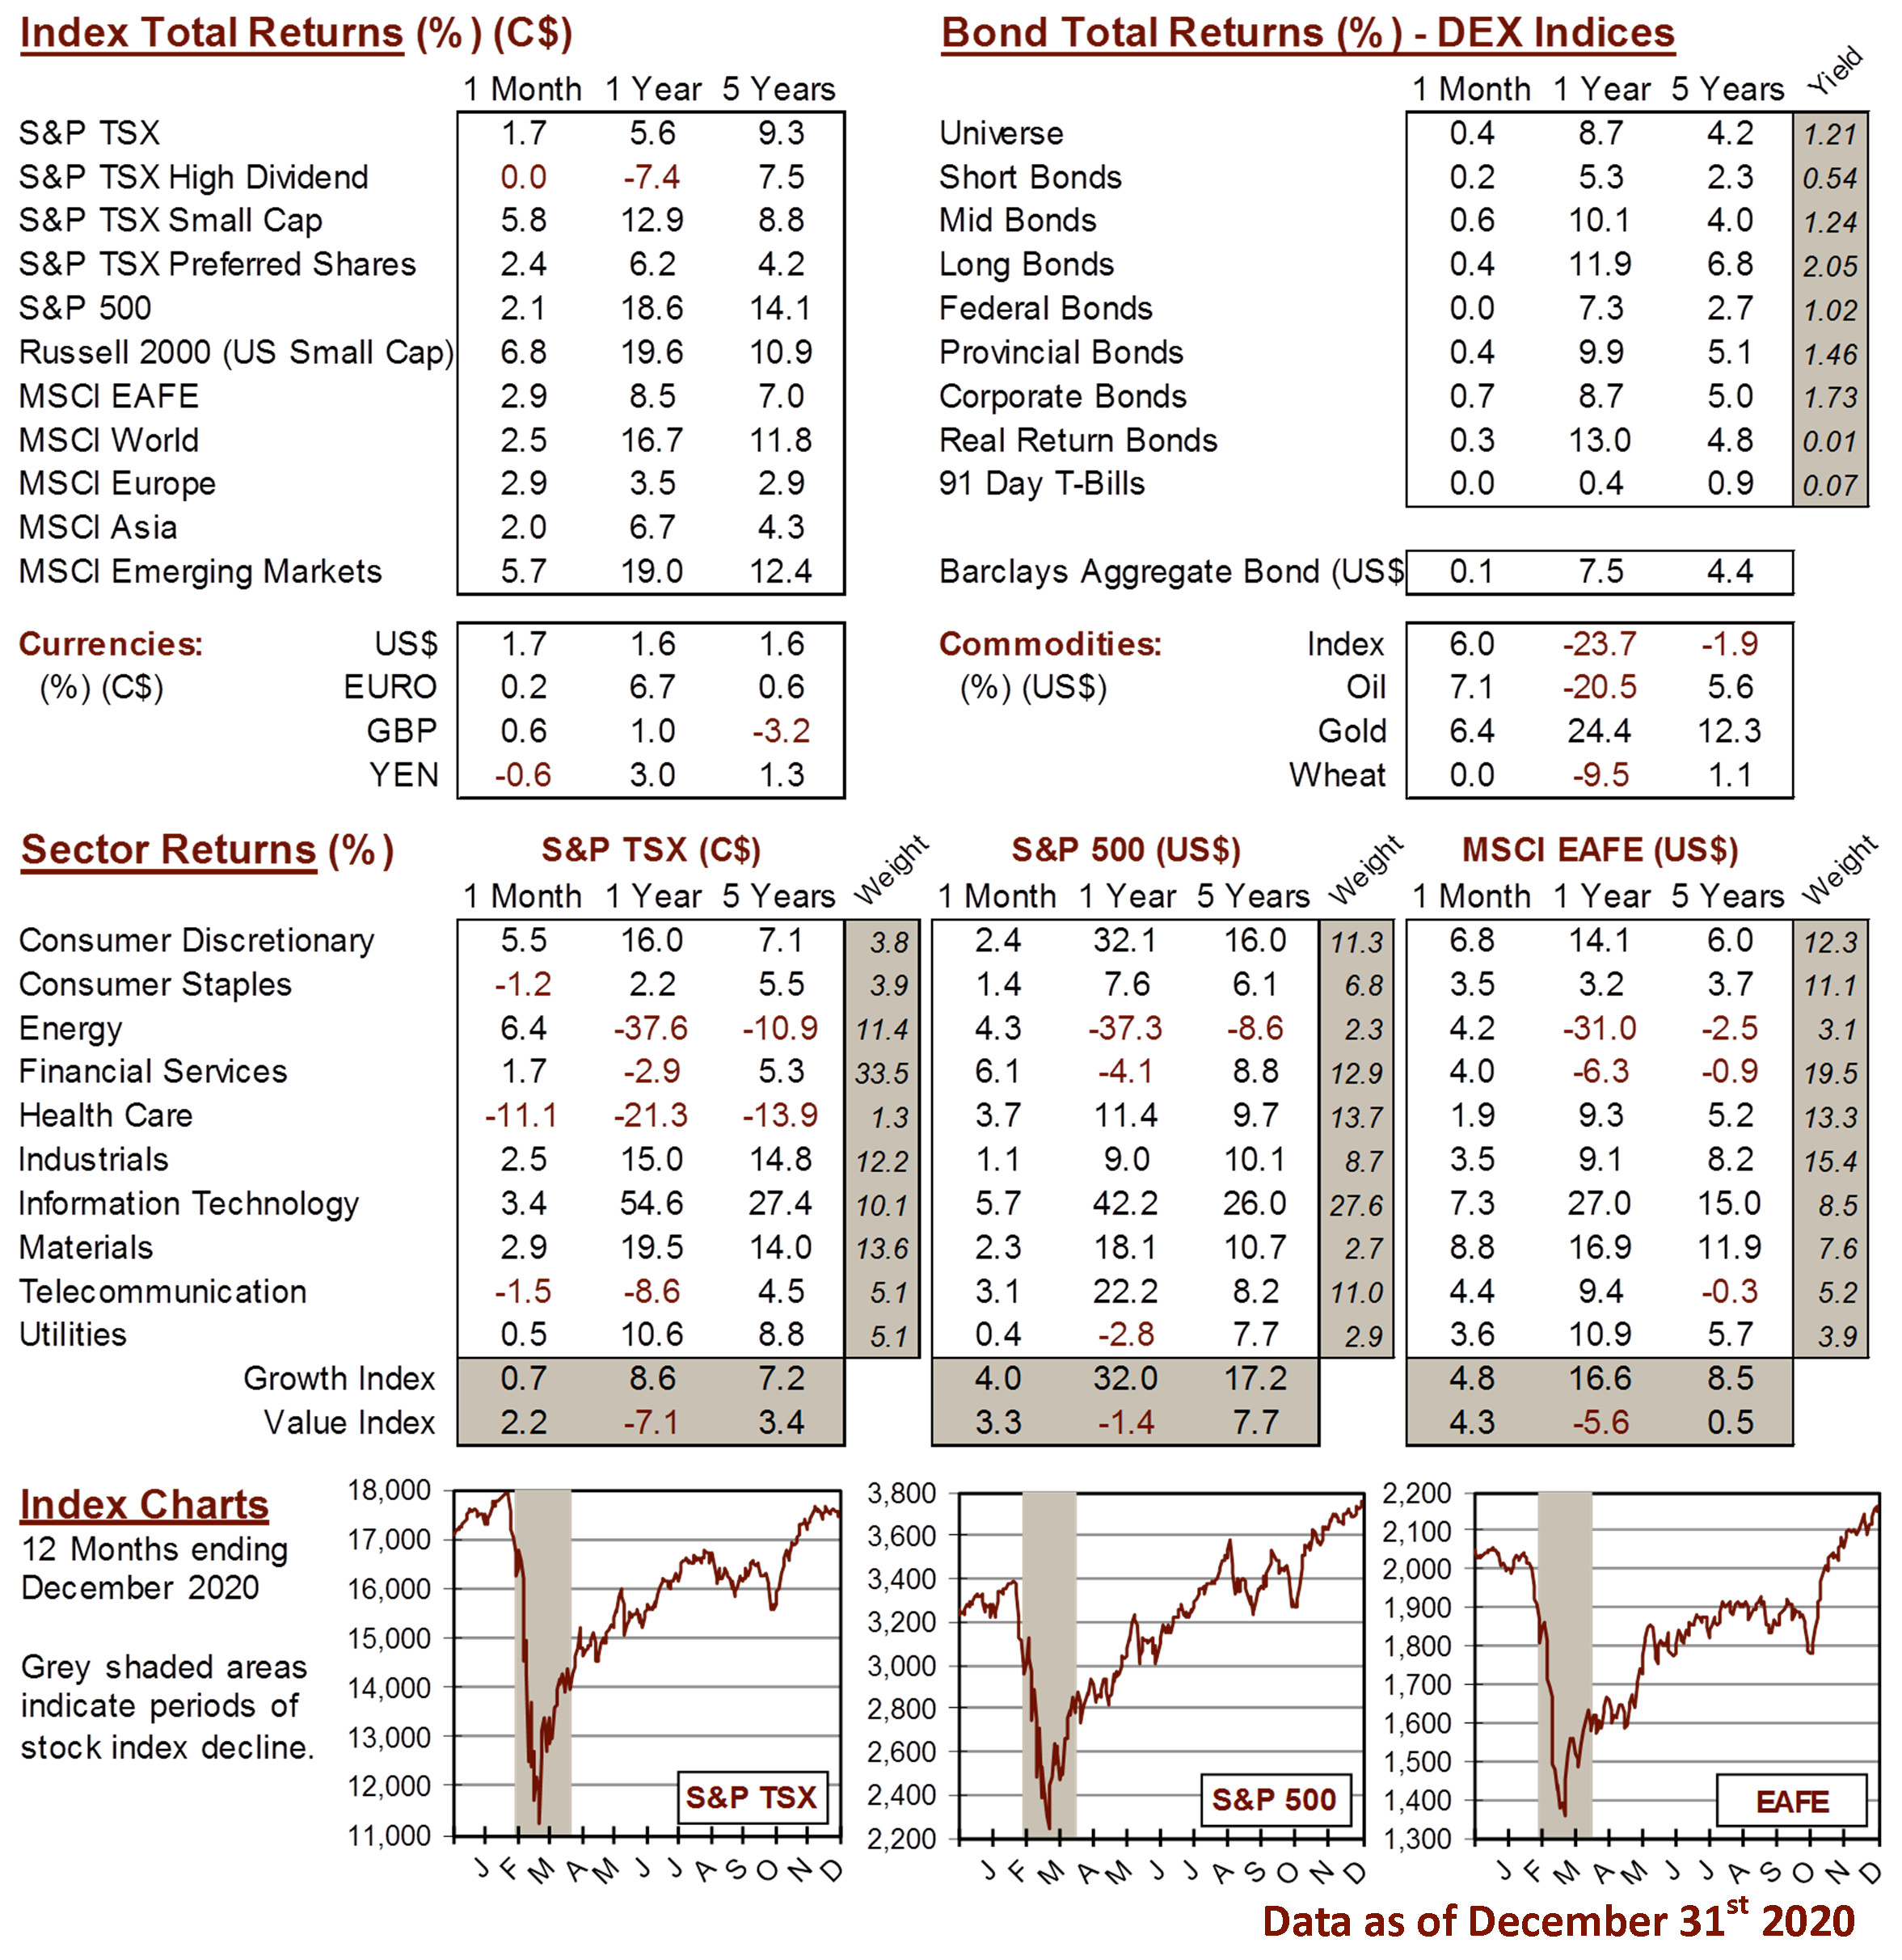
MARKET DATA
This report may contain forward looking statements. Forward looking statements are not guarantees of future performance as actual events and results could differ materially from those expressed or implied. The information in this publication does not constitute investment advice by Provisus Wealth Management Limited and is provided for informational purposes only and therefore is not an offer to buy or sell securities. Past performance may not be indicative of future results. While every effort has been made to ensure the correctness of the numbers and data presented, Provisus Wealth Management does not warrant the accuracy of the data in this publication. This publication is for informational purposes only.
Contact Us
18 King St. East Suite 303
Toronto, ON
M5C 1C4