Knowledge Centre
The Most Important Security in Canada
February 2024
Generally, when inflation is high and volatile, stocks and bonds have a positive correlation meaning that their prices move in the same direction. When inflation is low and stable, stocks and bonds tend to have a negative correlation. Prior to 2022 there was a notable negative correlation between stocks and bonds with the two moving in opposite directions.
At the beginning of 2022, both the Canadian stock and bond markets were highly sensitive to interest rates. The Bank of Canada (BOC) bank rate sat just above 0% giving investors very little cushion in the event that rates started to move back up. When the BOC did begin its rate hiking cycle, both asset classes sold off significantly resulting in a positive stock and bond correlation. Currently, this positive correlation between stocks and bonds is the strongest it has been in years if not decades.
This raises the question of how and when inflation will decrease and stabilize, allowing stocks and bonds to revert back to their long term relationship because clearly the negative correlation between bonds and stocks has been a benefit to balanced portfolios.
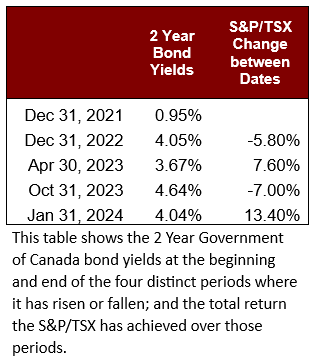
Currently, short term bond yields are not moving in sync with stocks. The Bank of Canada historically controls yields for cash as far out as 18 months; yields beyond this are controlled by investors based upon their perspective of the current conditions and how the future could unfold. 2 Year bond yields reflect the market’s best guess about the Bank of Canada’s rate over the next 24 months and in the context of the last few years of monetary policy. It shows how investors have been trying to predict where short term rates need to go to bring inflation back down to the target of 2%.
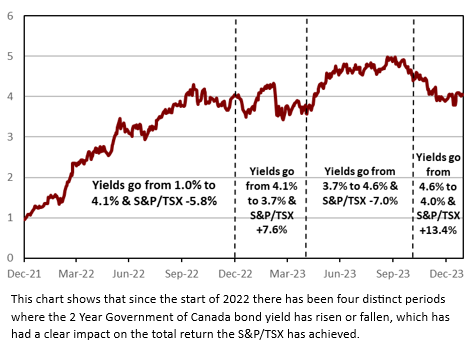
Observe the 2 Year Government of Canada bond which is the most important security in Canada, at least when it comes to the direction of the S&P/TSX Composite Index (S&P/TSX). The chart to the right shows how the 2 Year bond yields have moved since the start of 2022 and how the S&P/TSX has performed over those periods of rising, stable or declining rates. The relationship is clear. When 2 Year bond yields are rising, stocks drop (all of 2022, April-October 2023). When they are relatively stable (January-April 2023, even with the sudden drop due to the U.S. bank mini crisis) or declining (November 2023 to present), stocks go up.
This impacts stocks because when yields move higher the market frets that final policy rates will be far higher still than current levels. This raises the specter of recession since the Canadian economy can only withstand a certain level of interest rates before it buckles under the strain. No one knows where that level is, so any marked increase in yields is unwelcome.
Crucially, the 5% level on 2 Year bond yields is a break point for equity investor psychology. Last year’s market pullback between April and October occurred as yields rose almost above 5% (peaking twice at 4.98% on September 19th and October 3rd) and looked liked it was going to go higher; the latest fall in yields eased those concerns.
For most investors a negative stock and bond correlation is helpful because it enhances the diversification within a typical portfolio. There is still some uncertainty about when the BOC will ease monetary policy and it likely will be better for stocks if bonds indicate the pivot is coming sooner rather than later. The takeaway from all this is that 2 Year bond yields will likely determine whether the S&P/TSX has a good year or great year.
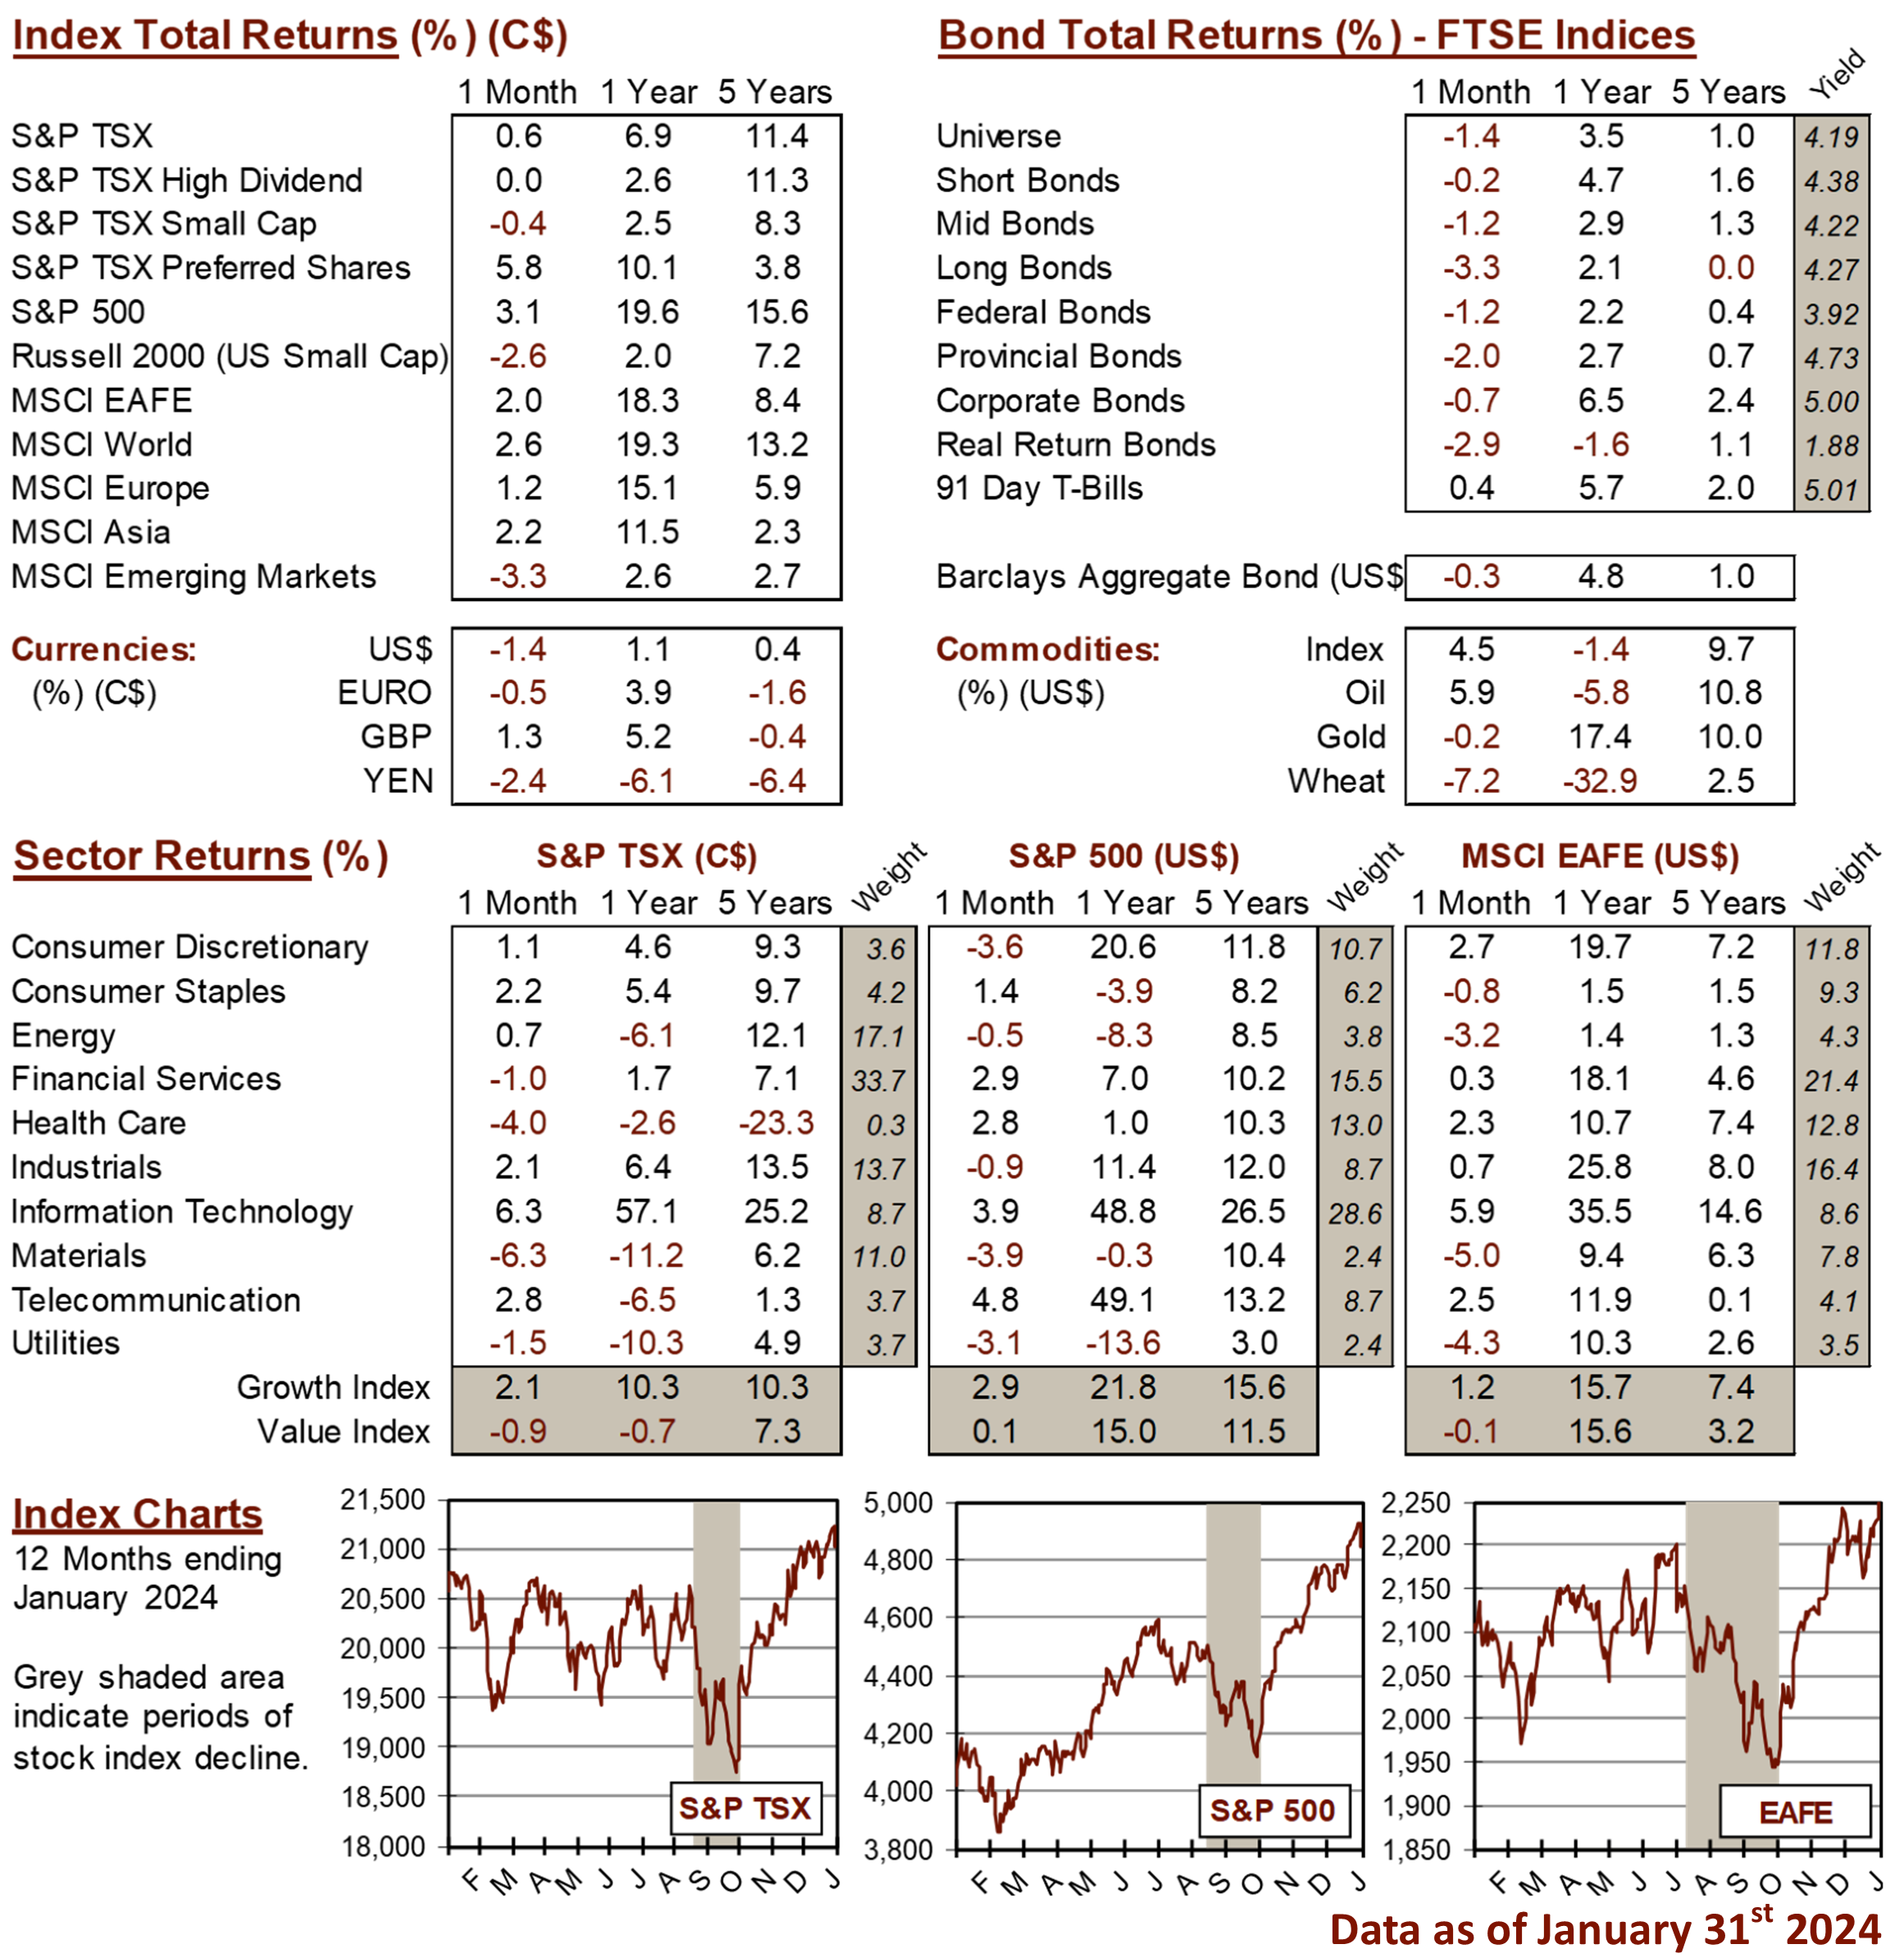
MARKET DATA
This report may contain forward looking statements. Forward looking statements are not guarantees of future performance as actual events and results could differ materially from those expressed or implied. The information in this publication does not constitute investment advice by Provisus Wealth Management Limited and is provided for informational purposes only and therefore is not an offer to buy or sell securities. Past performance may not be indicative of future results. While every effort has been made to ensure the correctness of the numbers and data presented, Provisus Wealth Management does not warrant the accuracy of the data in this publication. This publication is for informational purposes only.
Contact Us
18 King St. East Suite 303
Toronto, ON
M5C 1C4