Knowledge Centre
Stock Market Concentration
March 2024
For all the talk about the Magnificent Seven in the U.S. and the global reliance on just a handful of companies to drive stock market returns it is still quite surprising just how concentrated some of the world’s stock markets really are. Today’s stock market concentration, which is defined as the extent to which shares are dominated by a small number of companies, is reaching new extremes. For various countries, the concentration of the largest 10 domestic stocks relative to that country’s overall stock market is currently at the 86th percentile relative to historical levels.
The recent rise in stock market concentration has been the steepest in 60 years, with a few stocks driving most of the returns. This narrow leadership has largely been a result of global central banks pivoting from a zero interest rate policy to a “higher rates for longer” regime to counter stubbornly high inflation. Sharply higher rates and a slower growth outlook have resulted in an outflow from long term investing practises and cyclical stocks. Mega cap stocks have been the primary beneficiaries as they offer attractive liquidity, sustainable growth, and much stronger pricing power.
Market concentration, on the rise since the 2010s in most equity markets, accelerated rapidly during the pandemic. Market concentration is often taken as a proxy for the intensity of competition. In recent years changes in concentration have increasingly been used to argue that the intensity of competition is falling, that the growth of large firms with high market shares is driving up profits, damaging innovation and productivity, and increasing inequality.
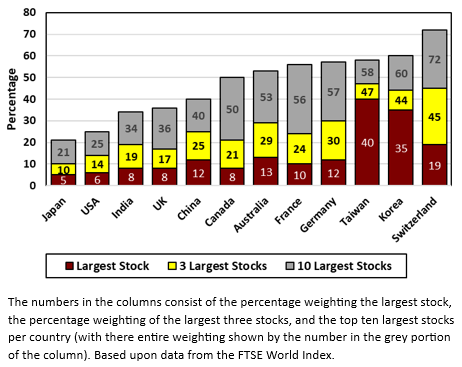
The chart to the right shows the concentration of the largest stocks per country (from least concentrated to most concentrated), its largest three stocks and its largest 10 stocks. The numbers in the columns consist of the percentage weighting of the largest stock; the percentage weighting of the largest three stocks (i.e. in Canada’s largest stock is 8% of the S&P / TSX); the top three stocks (i.e. 21% of the overall stock market in Canada); and the top ten largest stocks per country (with their entire weighting shown by the number in the grey portion of the column). So, 50% of Canada’s market is made up of just ten stocks.
These numbers are based upon data from the FTSE World Index which covers approximately 3,900 holdings in nearly 50 countries, including both developed and emerging markets, and covers more than 95% of the global investable market capitalisation. The U.S. stock market is the worlds largest and accounts for 65.4% of the index; while Canadian stocks, the fifth largest country, account for 2.6%. Japan, the U.K., and France are the other top five countries. The Magnificent Seven stock themselves are approximately the same size as these four nations combined!
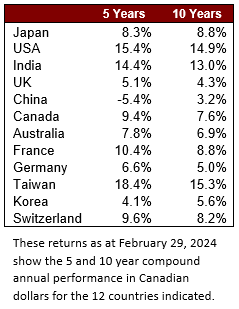
In general, the largest stocks by market cap tend to perform better than their peers and exhibit higher growth rates than the remaining stocks in the index. However, as the table to the left shows there is very little correlation between how concentrated a market is and how the market performs over various time periods. During periods of crisis like the COVID-19 pandemic, when the economy could slip into a recession, market concentration will remain narrow. In a soft landing scenario, the leadership would shift to broader, smaller, lower quality and cheaper companies. At the end of the day, a steep rise in concentration and narrow leadership has always reversed.
Research has found that periods of high concentration in markets have tended to be followed by periods of poorer performance by the bigger stocks. Given that the current concentration is extraordinarily outside of historical norms, the relative lack of diversification should not be ignored by investors. This could lead to significant challenges since the market is the most concentrated it has been since the mid 1970s. These stocks trade at a valuation premium that is near a four decade high. Most of the largest stocks are highly correlated with bonds so it should be no surprise that an extended era of low and declining interest rates has delivered a market that is concentrated in a few stocks. However, when those conditions change, a reversal could occur quickly.
The historical levels of equity concentration make for a challenging investing environment. Given the largest stocks hold significant sway over the direction of the overall equity indexes, the pressure of investors to participle is immense. Investment decisions and the timing of these decisions can be very tricky. A measured approach to investing is an effective way to enjoy some of the benefits of highly concentrated stocks while reducing the risk of a large drop if fortunes reverse.
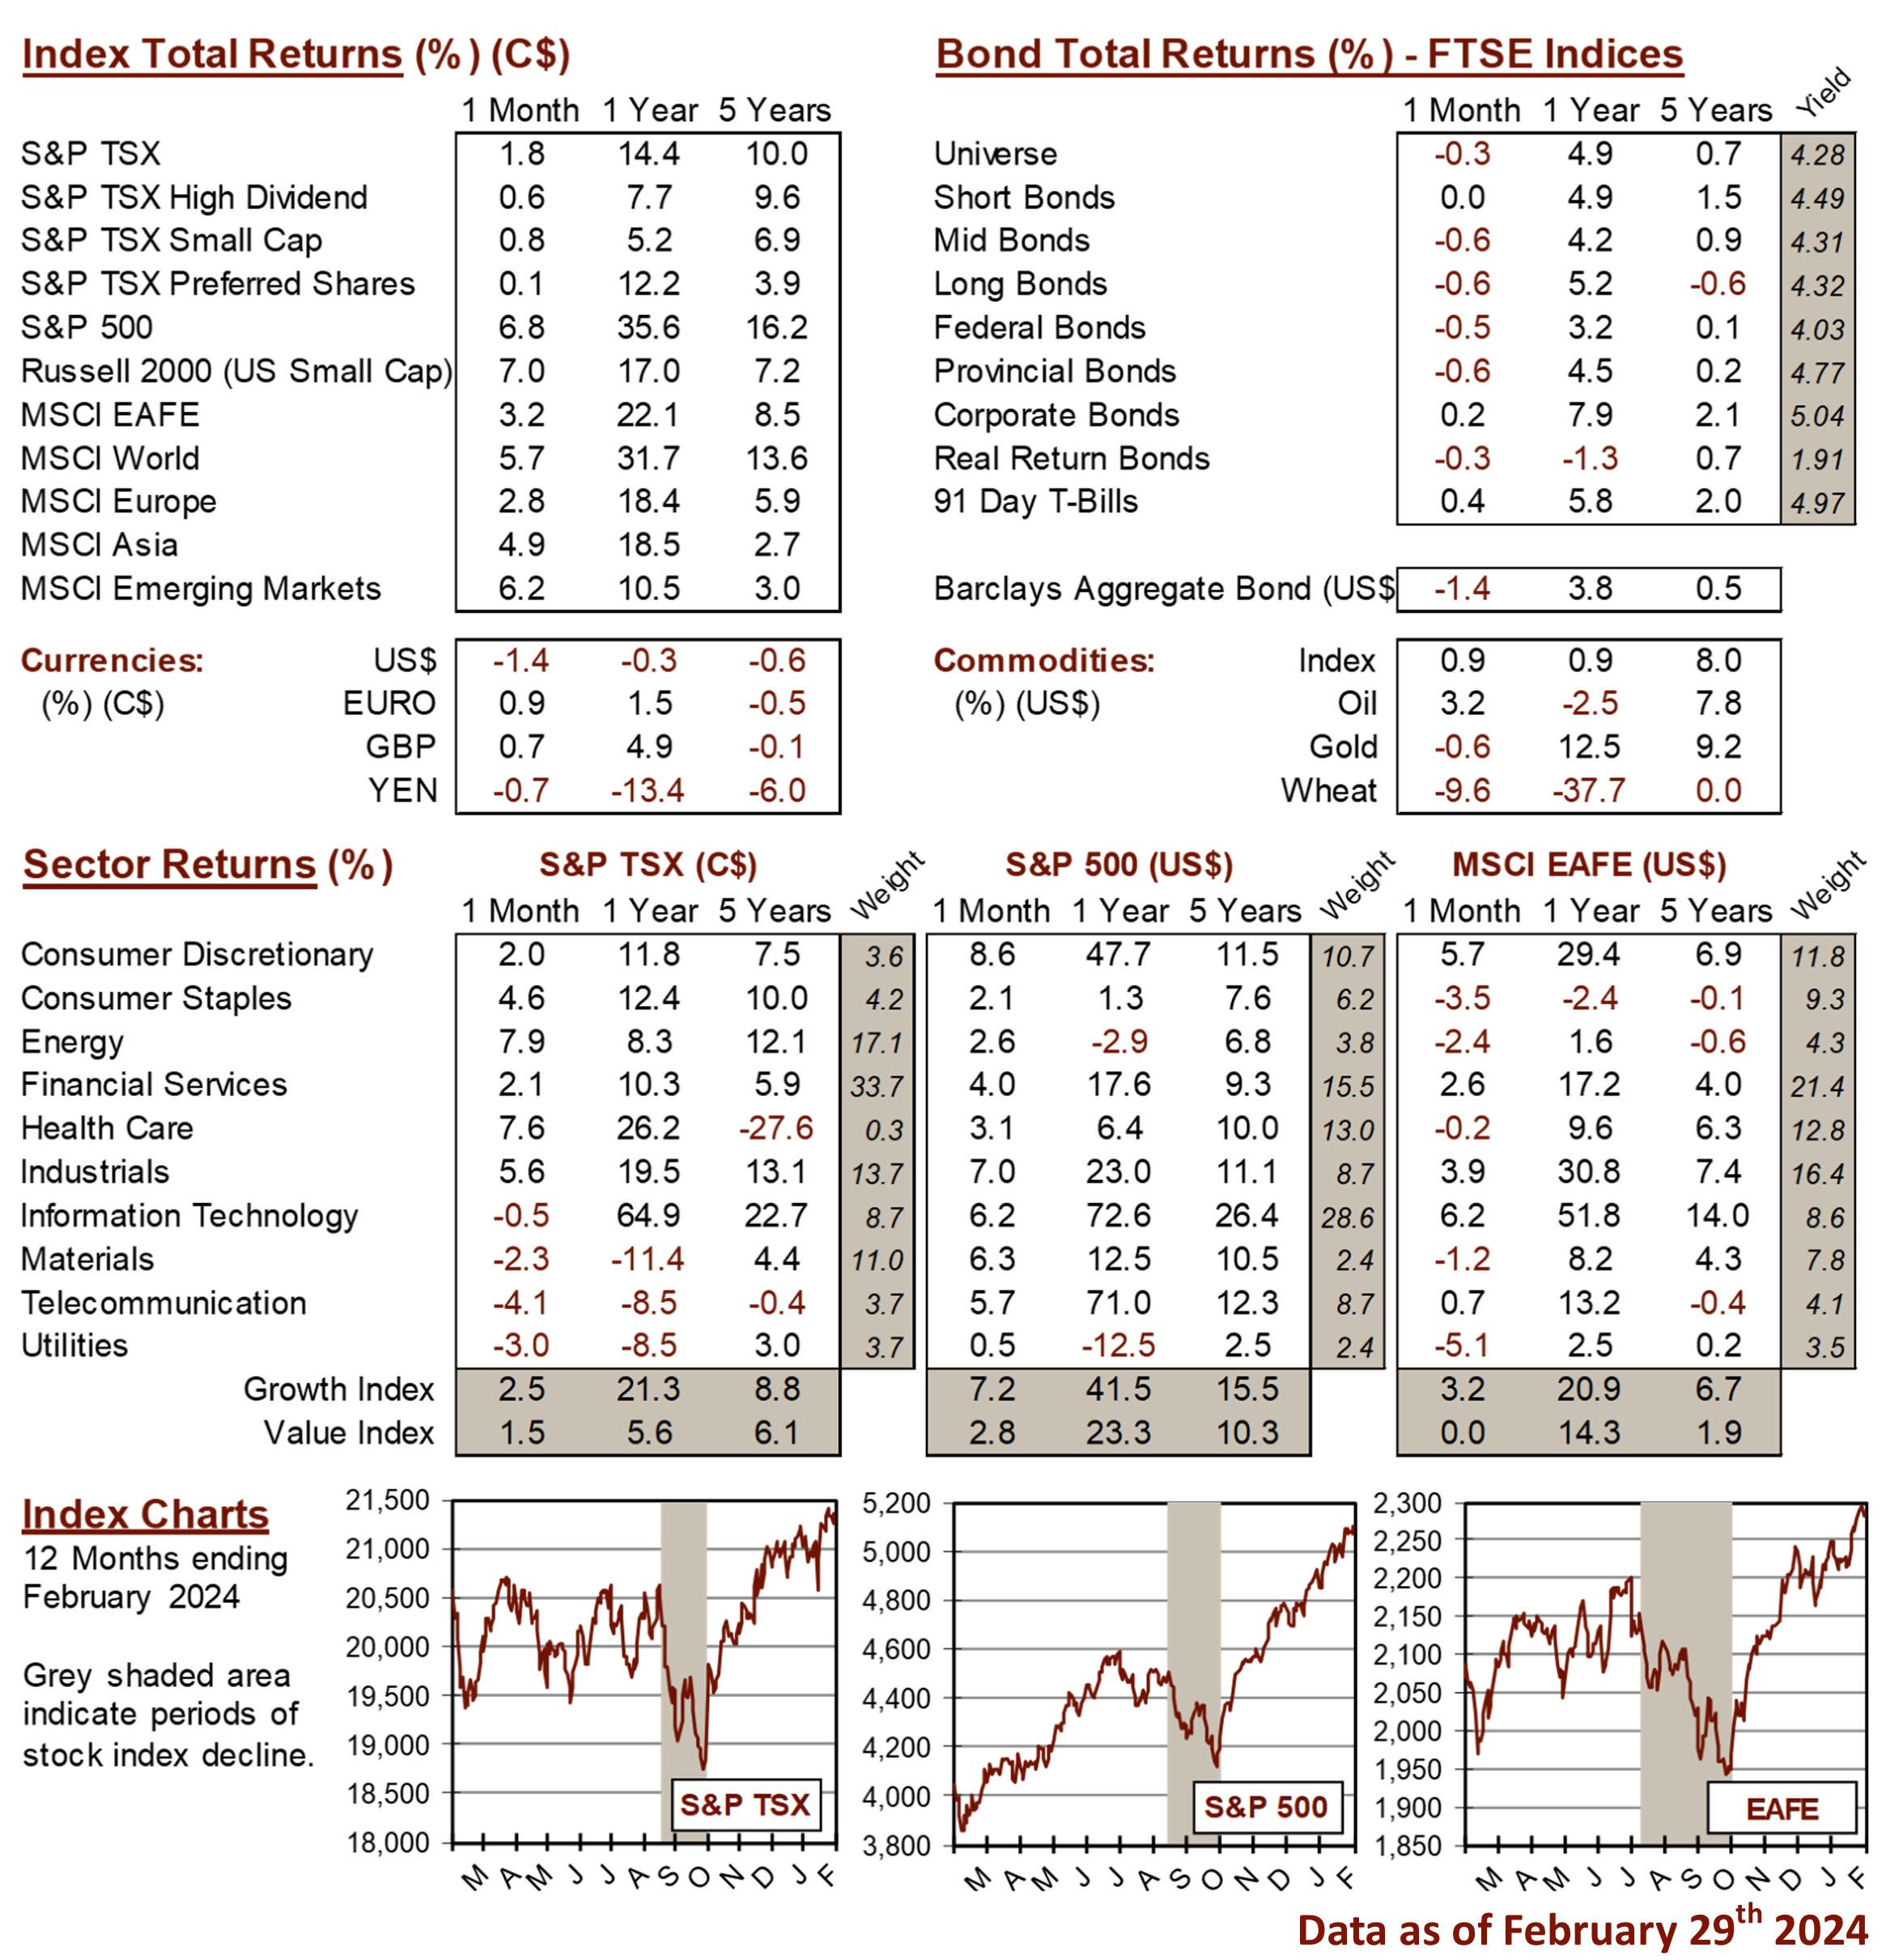
MARKET DATA
This report may contain forward looking statements. Forward looking statements are not guarantees of future performance as actual events and results could differ materially from those expressed or implied. The information in this publication does not constitute investment advice by Provisus Wealth Management Limited and is provided for informational purposes only and therefore is not an offer to buy or sell securities. Past performance may not be indicative of future results. While every effort has been made to ensure the correctness of the numbers and data presented, Provisus Wealth Management does not warrant the accuracy of the data in this publication. This publication is for informational purposes only.
Contact Us
18 King St. East Suite 303
Toronto, ON
M5C 1C4