Knowledge Centre
Reversing the Performance Difference
August 2018
The performance difference between Canadian and U.S. stocks has been very pronounced over the past few years, but that could be about to change. Of course, the U.S. is a growth stock market and Canada is deep value, which as most investors know do very well during the late stages of an economic cycle. Since, Canada is relatively commodity price sensitive, which means the Canadian market is a much more effective hedge against inflationary pressures, which leads to Canada almost always outperforms the U.S. late in the investment cycle. Throw in the discrepancy in stock market valuations and equity risk premiums the case for choosing Canadian stocks is become quite compelling.
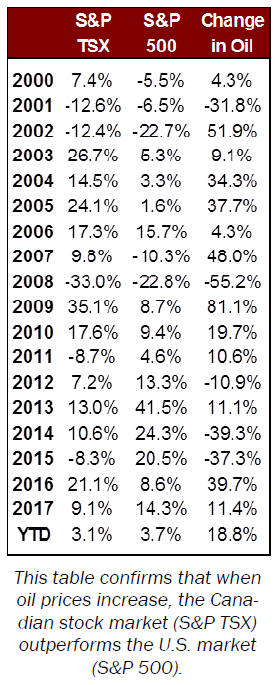
In fact, Canadian stocks frequently rise as the U.S. market declines or heads into recession as happened from August 2007 to August 2008 when the S&P/TSX index rose 3.5% while the S&P 500 sagged -10.7% (all figures in Canadian dollar terms). The reason for this can be summed up in one word: oil. Oil prices surged 56% which allowed the Canadian energy sector to advance 16%. The same thing happened in 2005, when the S&P 500 was only up 1.6% for the year, while the S&P/TSX rose more than 24.1%. Again, because of oil prices surged 37.7% and the Canadian energy space jumped 45%.
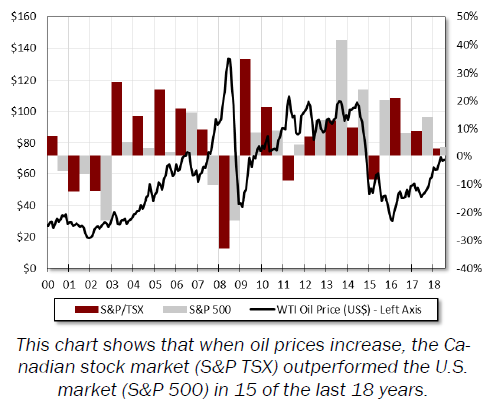
These are not isolated instances, but in fact highly correlated recurring events. Oil prices increase and Canadian stock markets out performance U.S. stocks; oil prices decline and Canadian stock markets lag behind U.S. stocks. This is not the case in most other stock markets, but none of them have currently have over 20% of there stock weighting in the energy sector and 30% in 2008 when oil prices reached its peak, like Canada does. For most of the rest of the worlds major stock markets the Energy sectors peaked out at 12% weighting versus a relatively meager 6% today.
The relationship between stocks markets and oil is volatile, with the correlation between the returns for stocks and oil prices swinging between positive and negative values depending upon the time period used. However, the correlation is very positive for Canadian stocks versus U.S. stocks over longer time periods.
The chart the right and the data to the left, clearly show that on an annual basis, when oil prices increase the Canadian stock market does better that the U.S. market, in fact this outperforming correlation occurs 83% of the time. Over the past 18 years this relationship has only broken down 3 times: 2011, 2013 and last year, 2017. And other than, 2011 Canadian stocks gained on average 11.0% during the other two years, which are better than long term stock market performance. The problem has not been Canada, it has been the U.S. stock market producing abnormally large returns during 2013 and 2017, 27.9% on average.
When it comes to the relationship between oil and stock pricing, normally a moderate correlation does exist. However, when it comes to different markets and their underlying core components the price change in oil can have a highly cyclical and major impact on results. It is crucial to keep this relationship in perspective during this period of late cycle U.S. market conditions since traditionally the best place to hide is the Canadian energy sector and Canadian stocks in general.
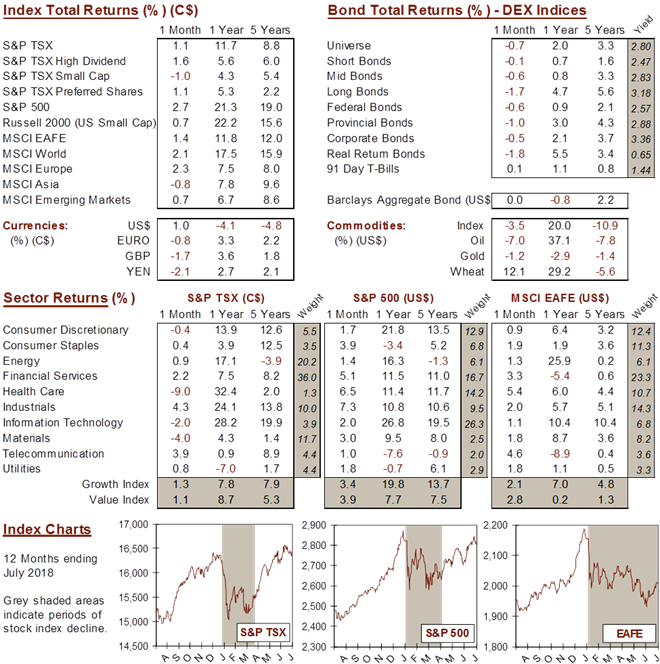
MARKET DATA
This report may contain forward looking statements. Forward looking statements are not guarantees of future performance as actual events and results could differ materially from those expressed or implied. The information in this publication does not constitute investment advice by Provisus Wealth Management Limited and is provided for informational purposes only and therefore is not an offer to buy or sell securities. Past performance may not be indicative of future results. While every effort has been made to ensure the correctness of the numbers and data presented, Provisus Wealth Management does not warrant the accuracy of the data in this publication. This publication is for informational purposes only.
Contact Us
18 King St. East Suite 303
Toronto, ON
M5C 1C4