Knowledge Centre
Markets Size Change Over Time
August 2023
Can anyone predict the future? Well, anyone can make predictions and while they can be entertaining, rarely are they insightful. Every forecast begs questions about its assumptions and invariably there are enough disagreements to discredit even a wise sage. However, history does provide insight when observed through the appropriate perspective. Investors who are weighing their options should consider historical equity returns and compare the results to other investment opportunities.
One approach to equity asset allocation is to track world market capitalization. Rather than investing solely in domestic securities simply because they are familiar, the world market capitalization approach allocates stock assets according to the relative size of individual stock markets. Equity market capitalization is a measure of the total market value of an equity market. The measure is calculated by adding together the market capitalization value of all the companies in that market in order to arrive at the capitalization for the market as a whole. Then by considering the returns obtained for these countries over a long term perspective (and 123 years is about as far back as you can reliably review), investors can get a very good picture of how the world’s various equity markets have evolved.
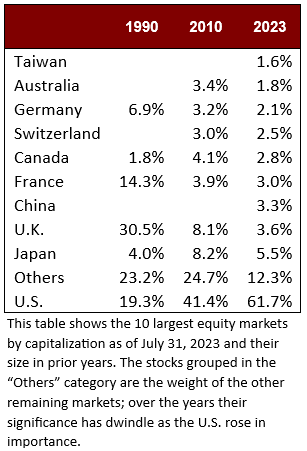
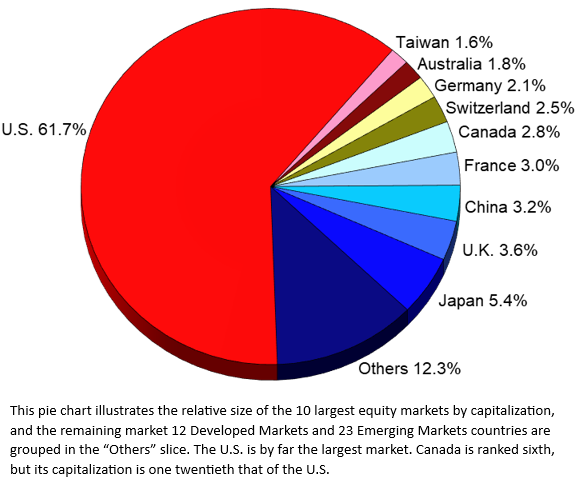
The countries shown in the accompanying chart make up 85% of the world’s market capitalization versus 83% in 2010 and 89% of it in 1900. The weightings for most countries have shrunk over the years due to the incredible growth and domination of the U.S. equity market: it climbed from 19.3% in 1900; to 41.4% in 2010; and now represents a staggering 61.7% of the world’s equities. Emerging Markets, which were a relatively minor portion of the world stock markets not long ago, have had explosive growth and now represent 12.0% of the world’s equity weighting versus 0.9% in 1988. China is the largest member of this group with a 3.3% weighting currently versus 6.9% in 2010. The Canadian equity market dates back to 1861 and is the world’s sixth largest country (versus fourth in 2010), accounting for 2.8% of world capitalization versus 4.1% in 2010 and 1.8% in 1900.
Investment plans require a long-term focus; considering decades of results and not just recent trends over a few months. A sound plan also incorporates the most important lessons of the past and avoids excessive bets based on the prognostications of the latest guru. It is well documented that over the long term equities have performed better than bonds. Canadian equities were up 9.1% per year with income reinvested (all figures in U.S. dollar terms), beating bonds by 3.9% and cash by 4.4% per year since 1900. This is not too much below the U.S. market’s 9.4% annual return. The data to the left shows the weightings for the largest 10 countries market capitalization currently and how they faired over the past 123 years. Some countries rose from nothing, whereas others shrunk into nothingness (i.e., Belgium accounted for 3.8% in 1900 and is 0.4% currently; and Russia with 3.9% in 1900 and is now zero).
Some countries grow faster than others and that can generally be attributed to a reduction in market inefficiencies, changes in valuation technology, and / or improvements in both macroeconomic and financial fundamentals. A diversified portfolio can curtail losses and recover faster. While market correlations are converging internationally there is still an opportunity to enhance returns. Savvy investors have learned from history and are now more diversified than ever because most of us know that those who cannot remember the past are condemned to repeat it.
MARKET DATA
This report may contain forward looking statements. Forward looking statements are not guarantees of future performance as actual events and results could differ materially from those expressed or implied. The information in this publication does not constitute investment advice by Provisus Wealth Management Limited and is provided for informational purposes only and therefore is not an offer to buy or sell securities. Past performance may not be indicative of future results. While every effort has been made to ensure the correctness of the numbers and data presented, Provisus Wealth Management does not warrant the accuracy of the data in this publication. This publication is for informational purposes only.
Contact Us
18 King St. East Suite 303
Toronto, ON
M5C 1C4