Knowledge Centre
If the Equity Markets have bottomed, then…
December 2022
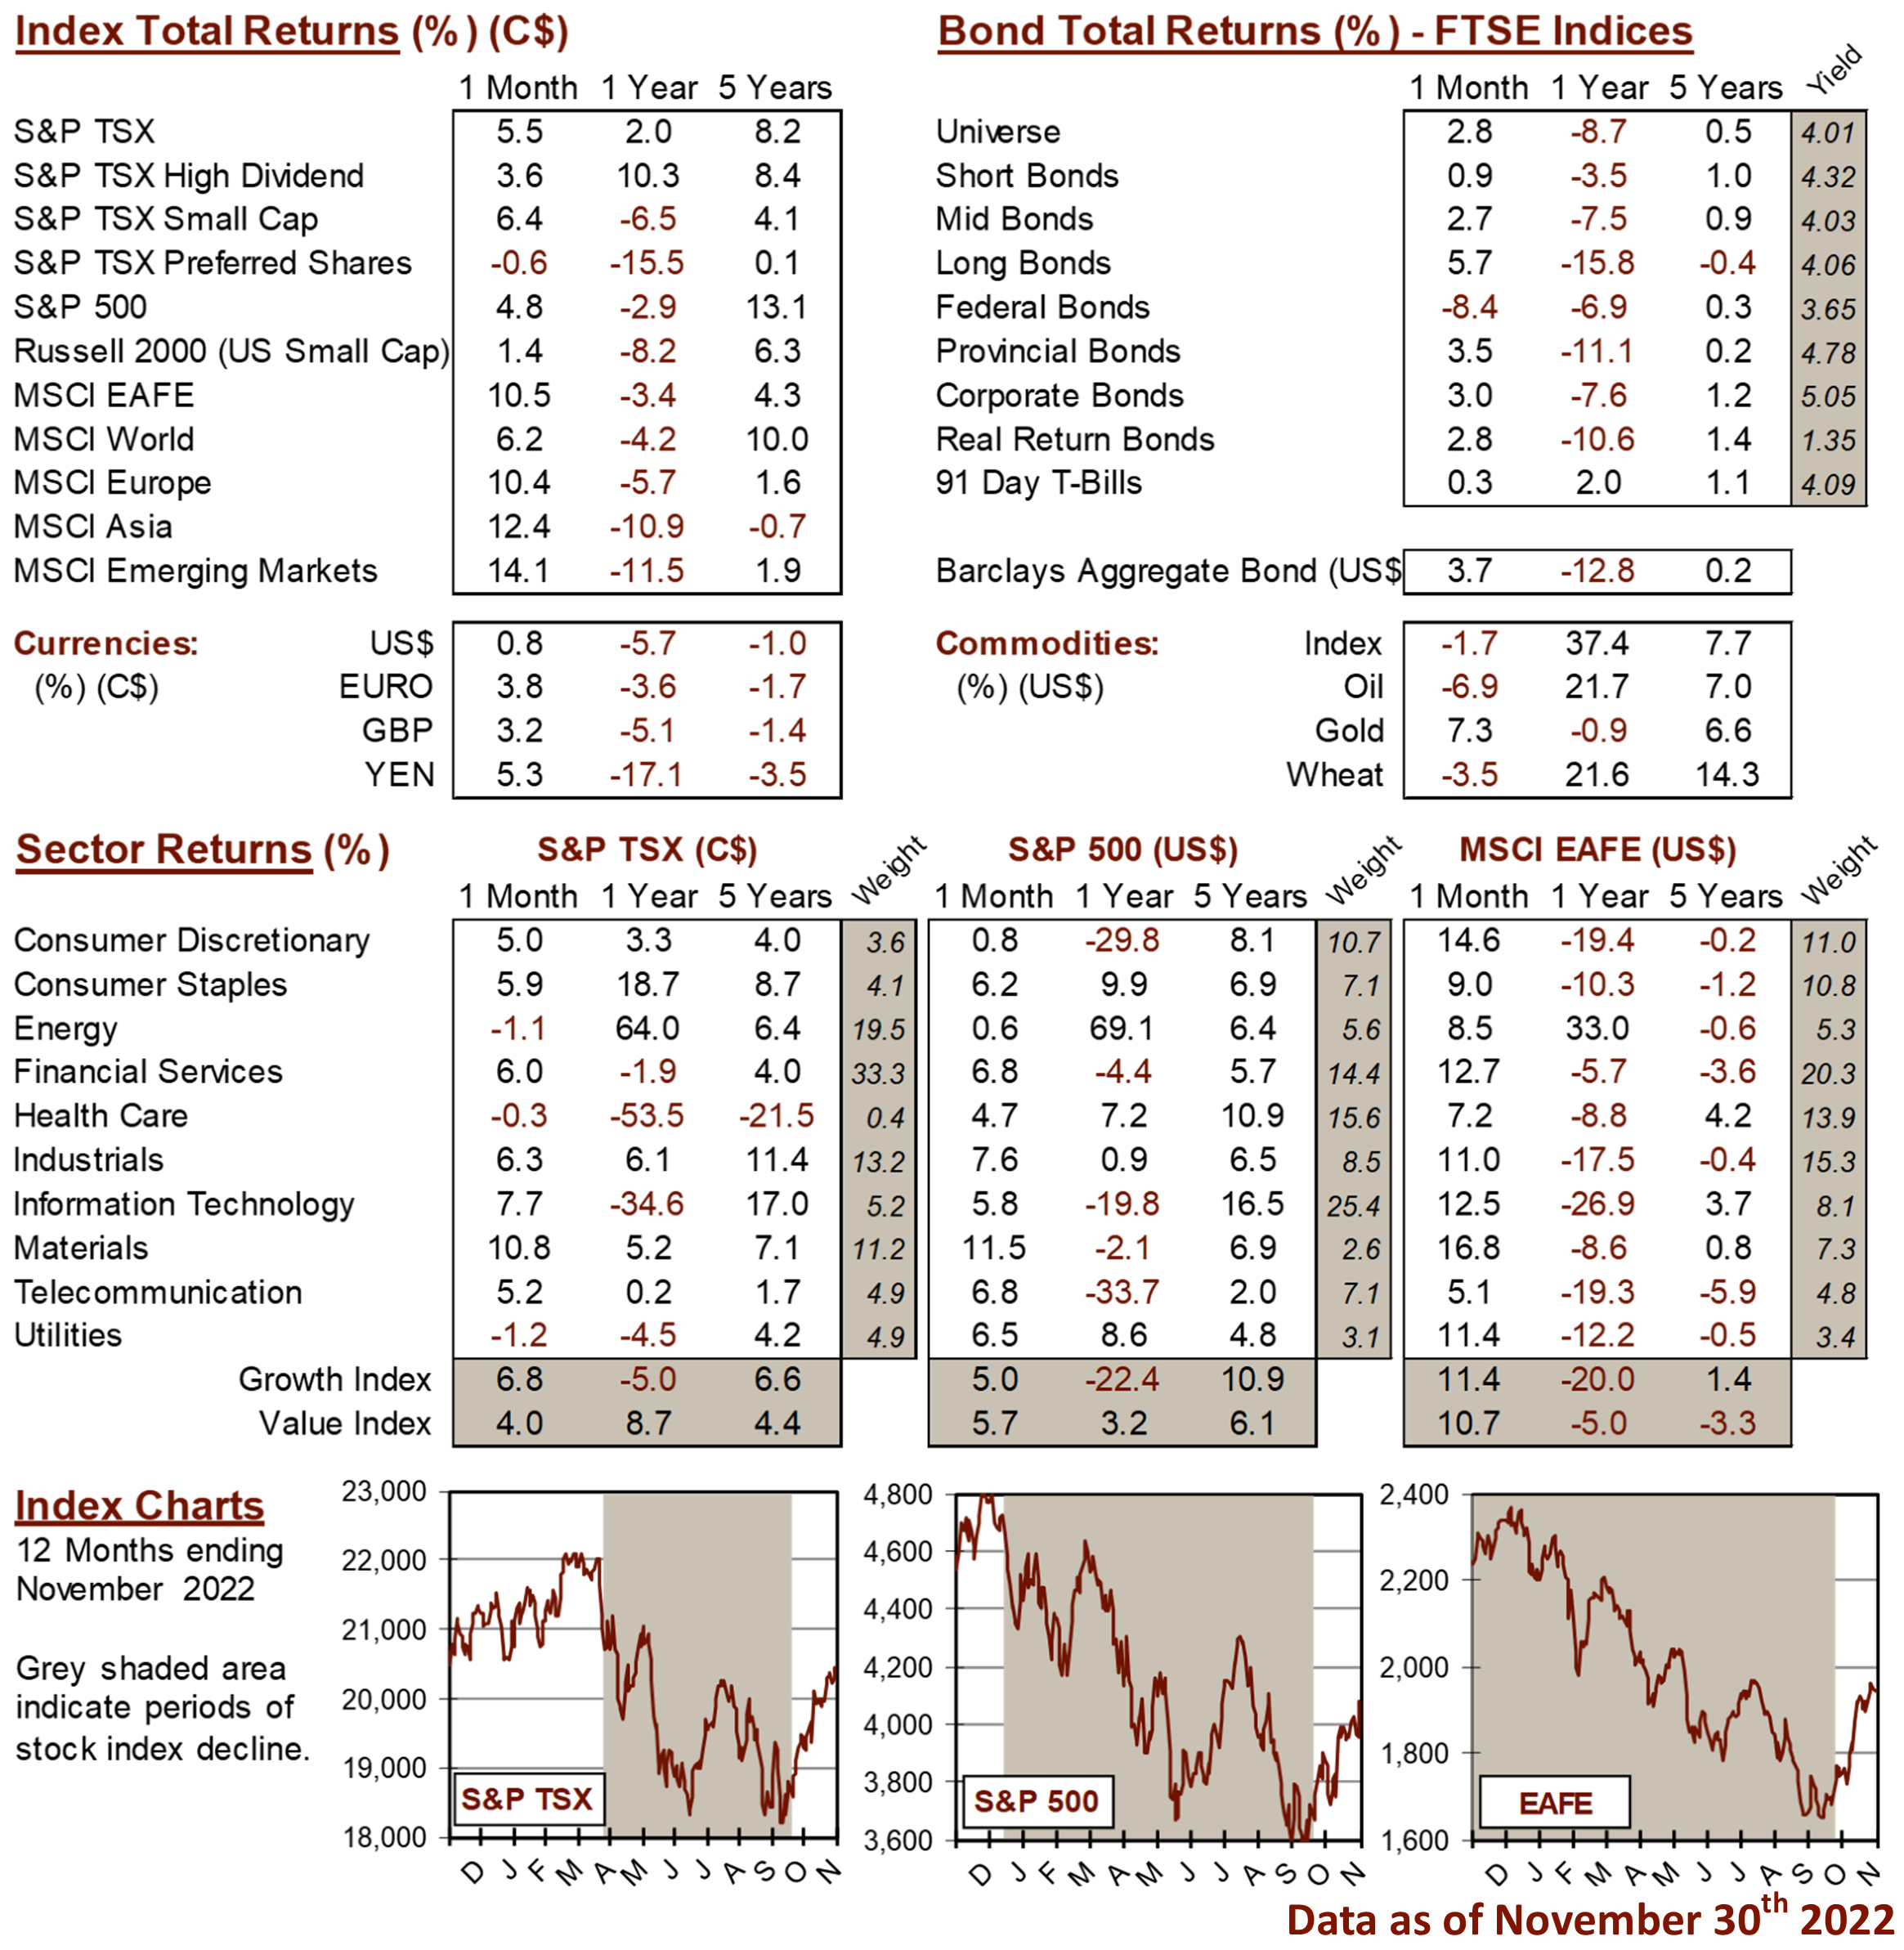
The Canadian stock market has rallied 10.4% since September 30th. After dramatic losses for the first three quarters of 2022, the market is only marginally down 1.0% year to date. While this year is not done yet and there is every possibility that the markets can push into positive territory, the fact remains that investments are down. What will the future bring? There is certainly a strong bullish case to be made because in 74% of the annual market declines going back to 1924, stocks gained ground in the second year after a bear market. This pattern of longer term market performance offers some reassurance, but we cannot blindly assume that the market will continue to perform as it has recently. Often a stock that builds momentum in one year carries it into the next. In the case of overall stock markets, the effect is not much different. Stocks surged in 2009 after getting trounced in 2008, and investors would love to see that trend reoccur in 2023.
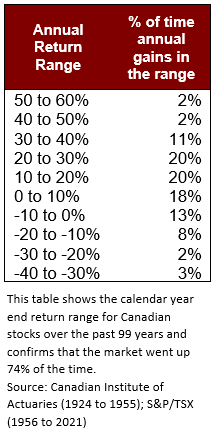
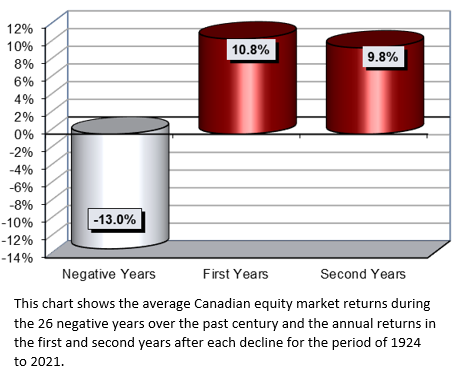
Consider the calendar year end returns for Canadian stocks using data from the S&P/TSX (1956 to 2019) and the Canadian Institute of Actuaries (1924 to 1955). The market rose in 73 of 99 years, or 74% of the time. This means that there were 26 calendar year periods of negative returns (26%). As the chart to the right shows, the average decline during these 26 years was -13.0% and the average return in the year following the decline was 10.8%. Perhaps even more interesting is the fact that in the second year after an annual decline the market continued to generate impressive gains which averaged 9.8% per year. If we exclude the four years of the Great Depression (1929-1932) the average annual gains in both the first and second years following annual declines were more than 13.0%.
Using history is a guide, the second verse will likely echo the first. In a rally’s first year, small cap shares typically beat their large cap rivals though a rising tide lifts all boats. Across the capitalization range, low quality issues generally outdo high quality as investors get more comfortable with risk. The worst stocks perform best and economically cyclical sectors outperform defensive ones. In the second year, the higher quality issues with stable and growing earnings begin to trump the lower quality names. The second year is especially important because it gives a clue as to the industries that are likely to outperform over several years so long as the economy keeps growing.
What seems to drive the second year after a winning year for the markets are mutual fund investors who had continued to remain wary of stocks. Ask most financial professionals and they will tell you the same thing. Investors flee the stock market and then jump back in but are often too late to capture most of the rebound. The evidence of the past year supports that view as new money coming to stock mutual funds has been negligible even as returns have been among the best on record. An influx into stocks in the coming months would suggest investors once again waited too long.
While equity mutual funds typically see outflows in the early stages of a bull market, some categories fared much better than others. This is likely the sixth bull market since 1987 and each time net inflows into stocks have been slow to get going before jumping in the second year after a market bottom. Will investors return this year in greater numbers, repeating the pattern of previous bull markets? History may not repeat itself but it could rhyme and that will be great news for diligent investors.
MARKET DATA
This report may contain forward looking statements. Forward looking statements are not guarantees of future performance as actual events and results could differ materially from those expressed or implied. The information in this publication does not constitute investment advice by Provisus Wealth Management Limited and is provided for informational purposes only and therefore is not an offer to buy or sell securities. Past performance may not be indicative of future results. While every effort has been made to ensure the correctness of the numbers and data presented, Provisus Wealth Management does not warrant the accuracy of the data in this publication. This publication is for informational purposes only.
Contact Us
18 King St. East Suite 303
Toronto, ON
M5C 1C4