Knowledge Centre
Gold Anyone?
May 2024
Gold as an investment has had a chequered history in modern times. Gold does well when monetary and fiscal policies are poor and does poorly when policies are good. Currently, with budget deficits expanding, gold is soaring but given that it has languished in the past the reality is that gold is coming off a very low base. During World War II the Bretton Woods agreement stopped hyperinflation by anchoring currencies to the U.S. dollar and in turn pegging the dollar to gold at $35 an ounce. This pricing worked for 25 years but by the 1970 currencies traded freely and gold was artificially undervalued by the peg. In 1971 the U.S. pulled the plug on the gold standard and gold prices shot up to more than $40. Throughout the next decade the world was clobbered by high inflation, high unemployment, and low growth so prices shot up again from $40 to $850, a return of about 30% annually. After 1980 normalcy returned, gold fell back to $250 and then took 27 years to regain its 1980 high. Adjusting for inflation, gold would have to top almost $2,500 to get back to its 1980 high so in that context it has been one of the worst investments in modern memory.
With the U.S. dollar under pressure it may make sense for those holding a lot of U.S. dollars to diversify their holdings. Perfect examples are the world’s central banks which hold dollar-denominated assets like Treasury bonds. The Reserve Bank of India bought 18.5 tons of gold since the start of 2024 and now holds 822 tons, accounting for 8.5% of its foreign exchange reserves. Western Europe holds the largest gold reserve of any geographical region at 11,775 tons; North America would be next with 8,135 tons (this is all in the U.S. which has the largest reserve of any single country; the Canadian government holds zero despite being the being the worlds 4th largest producer of gold).
The Bank of Canada’s objective is to keep the yearly inflation rate at or below 2%, and the most recent CPI number came in at 2.9% for the 12 months to March. Most indicators highlight primarily deflationary forces influencing the developed world at present. Consumer wages are stabilizing in many countries, banks have cut lending to businesses, factory capacity utilization is near or at all-time lows and consumers are paying down debt and increasing savings which cuts into demand for consumer products and services.
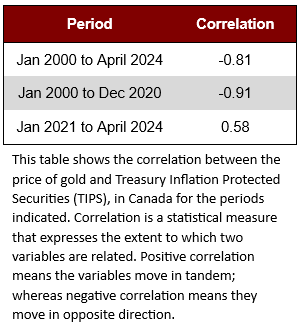
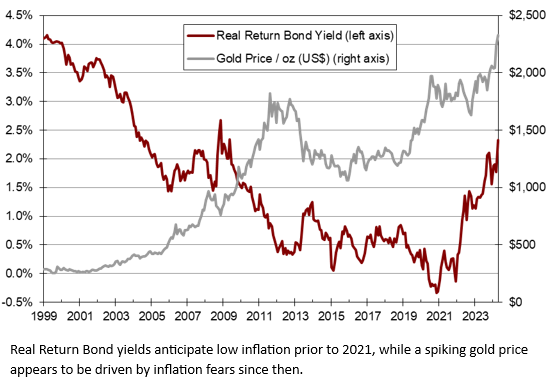
Warren Buffett criticized gold for just sitting there with no yield and having a long term value that is difficult to assess. Gold can do very well in extreme events such as hyperinflation. A key gauge for assessing inflation expectations is to look at Treasury Inflation Protected Securities (TIPS), a type of government bond that offers protection against inflation by earning a fixed amount plus inflation as measured by the Consumer Price Index (CPI). Historically, as the TIPS yield rate rises, gold has fallen and vice versa. The TIPS yield had plunged since 1999 due to the market’s expectations for little or no inflation but this has changed dramatically during the COVID-19 pandemic.
The chart above clearly shows an inverse relationship between gold prices and inflation expectations as reflected by the TIPS yield prior to 2021. In fact, there was a negative (-0.91) correlation. However, after the TIPS yield moved into negative territory for the first time ever, the entire script was turned on its ear. The TIPS yield has spiked as low inflation disappeared, and gold prices have surged as rampant inflation took hold. This triggered an absolutely stunning reversal in the relationship between gold and real yields, shifting to a positive correlation of 0.58. This begs the question: is the surging gold price along with an increasing TIPS yield a new patter and investment opportunity or a developing bubble? Inflation has come down significantly from a high of 8.1% in June 2022, how dramatically will the TIPS yield plunge when interest rates start to fall? And do gold prices follow or revert to the historical negative correlation?
MARKET DATA
This report may contain forward looking statements. Forward looking statements are not guarantees of future performance as actual events and results could differ materially from those expressed or implied. The information in this publication does not constitute investment advice by Provisus Wealth Management Limited and is provided for informational purposes only and therefore is not an offer to buy or sell securities. Past performance may not be indicative of future results. While every effort has been made to ensure the correctness of the numbers and data presented, Provisus Wealth Management does not warrant the accuracy of the data in this publication. This publication is for informational purposes only.
Contact Us
18 King St. East Suite 303
Toronto, ON
M5C 1C4