Knowledge Centre
Equity Yields Beat Bonds
February 2020
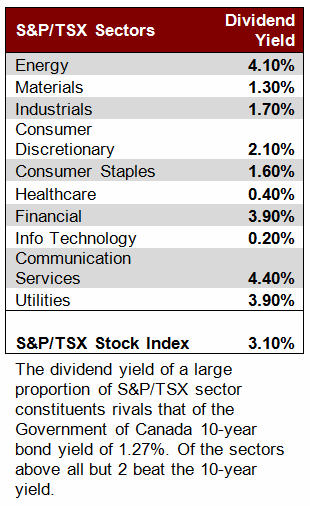
A buy signal may be flashing in the stock market, particularly relative to bonds. When you consider the state of the bond market, stocks look much less expensive. Yields on risk-free Government of Canada debt are near historical lows, which should be taken into consideration when valuing stocks because bonds are the primary alternative to stocks. The risk in bonds is now greater than in stocks and the upside potential in government bonds looks more limited. Ten year Government of Canada bonds now yield about 1.27%, which is near its recent 20 year low of 1.0% in September of 2016.
The term “yield” means a stream of income; the money you earn while holding stocks or bonds. Bonds always offer a yield as they always pay interest unless they go bankrupt. Stocks however, have a yield only if they pay dividends. A dividend payment represents the company rewarding investors with a portion of its income. The yield on a stock is the dividend as a percentage of the stock price. Generally speaking, the higher the yield, the higher the perceived risk in the investment.
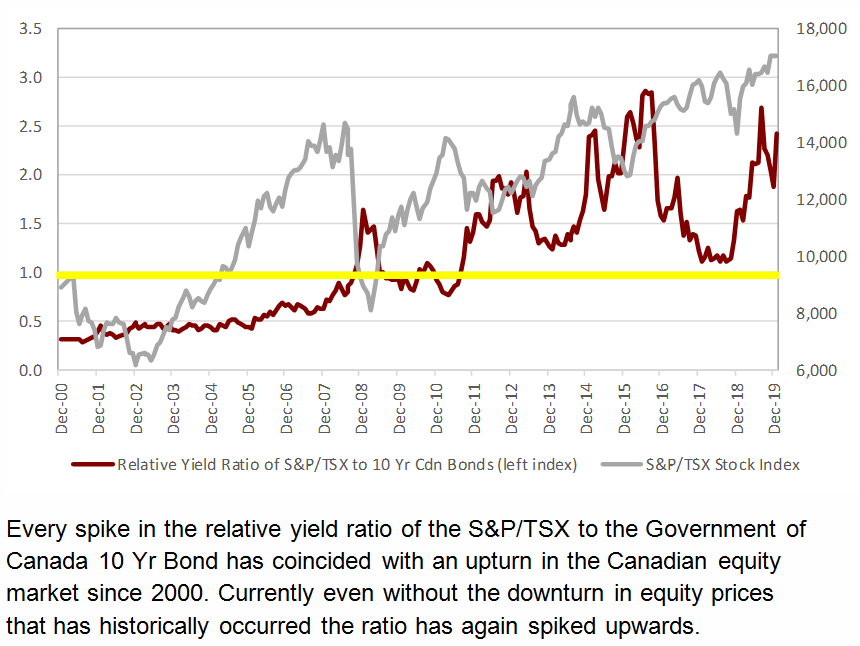
There is one indicator in particular that has historically proven to be a buy signal for the S&P/TSX stock; when the S&P/TSX dividend yield is higher than the 10 year Government of Canada bond yield. Given the S&P/TSX has historically outperformed the 10 year Government of Canada bond in terms of principal appreciation, investors start to get interested when the S&P/TSX yield alone is higher than the 10 year Government of Canada bond. Of course, this gets a little tricky right now because the S&P/TSX is close to an all-time high and the yield curve has inverted.
During the 2008 financial crisis, the 10 year Government of Canada bond yield collapsed as investors sought the safety of bonds. But the S&P/TSX dividend yield soared as the S&P/TSX crashed because companies were late in cutting their dividend payouts. As seen in the chart to the right, this was the first time this indicator flashed a meaningful buy signal since 2000 (i.e. the S&P/TSX dividend yield on a relative basis exceeded the bond yield), but not the last. In fact, every spike in this indicator coincided with market bottoms (March 2009; June 2012; January 2016 and December 2018) and marked the start of a new bull run. In fact, the last two spikes in the indicator represented two standard deviation abnormal events, which is a very powerful signal for future stock market appreciation.
Clearly, investors have poured into safe haven assets like bonds as trade talks flared up and global pandemic fears reverberate around the world, sending bond yields to near historic lows. Still, stock dividend yields are currently 240% higher. This does not mean bond yields cannot go lower. In Europe, 10 year government bond yields are up to 4.0% below the dividend yield on the European stocks. Nor is it a guarantee that stocks will rally as seen in Japan where dividend yields are around 2.0% higher than 10 year bond yields, but in the four years since the indicator flashed, Japanese stocks have gone almost nowhere.
The S&P/TSX dividend yield and 10 year Government of Canada bond yield analysis is not straight forward. Many investors would rather own bonds purely for safety. The argument to buy the S&P/TSX at all time highs, despite 60% of the S&P/TSX companies having higher yields (see current yields for the major stock market sectors in the table to the above left) than the 10 year Government of Canada bond yield is not conclusive, but it is comforting for stock investors to know that rational money will likely start slowly shifting out of bonds and into stocks due to the relative value the S&P/TSX now provides.
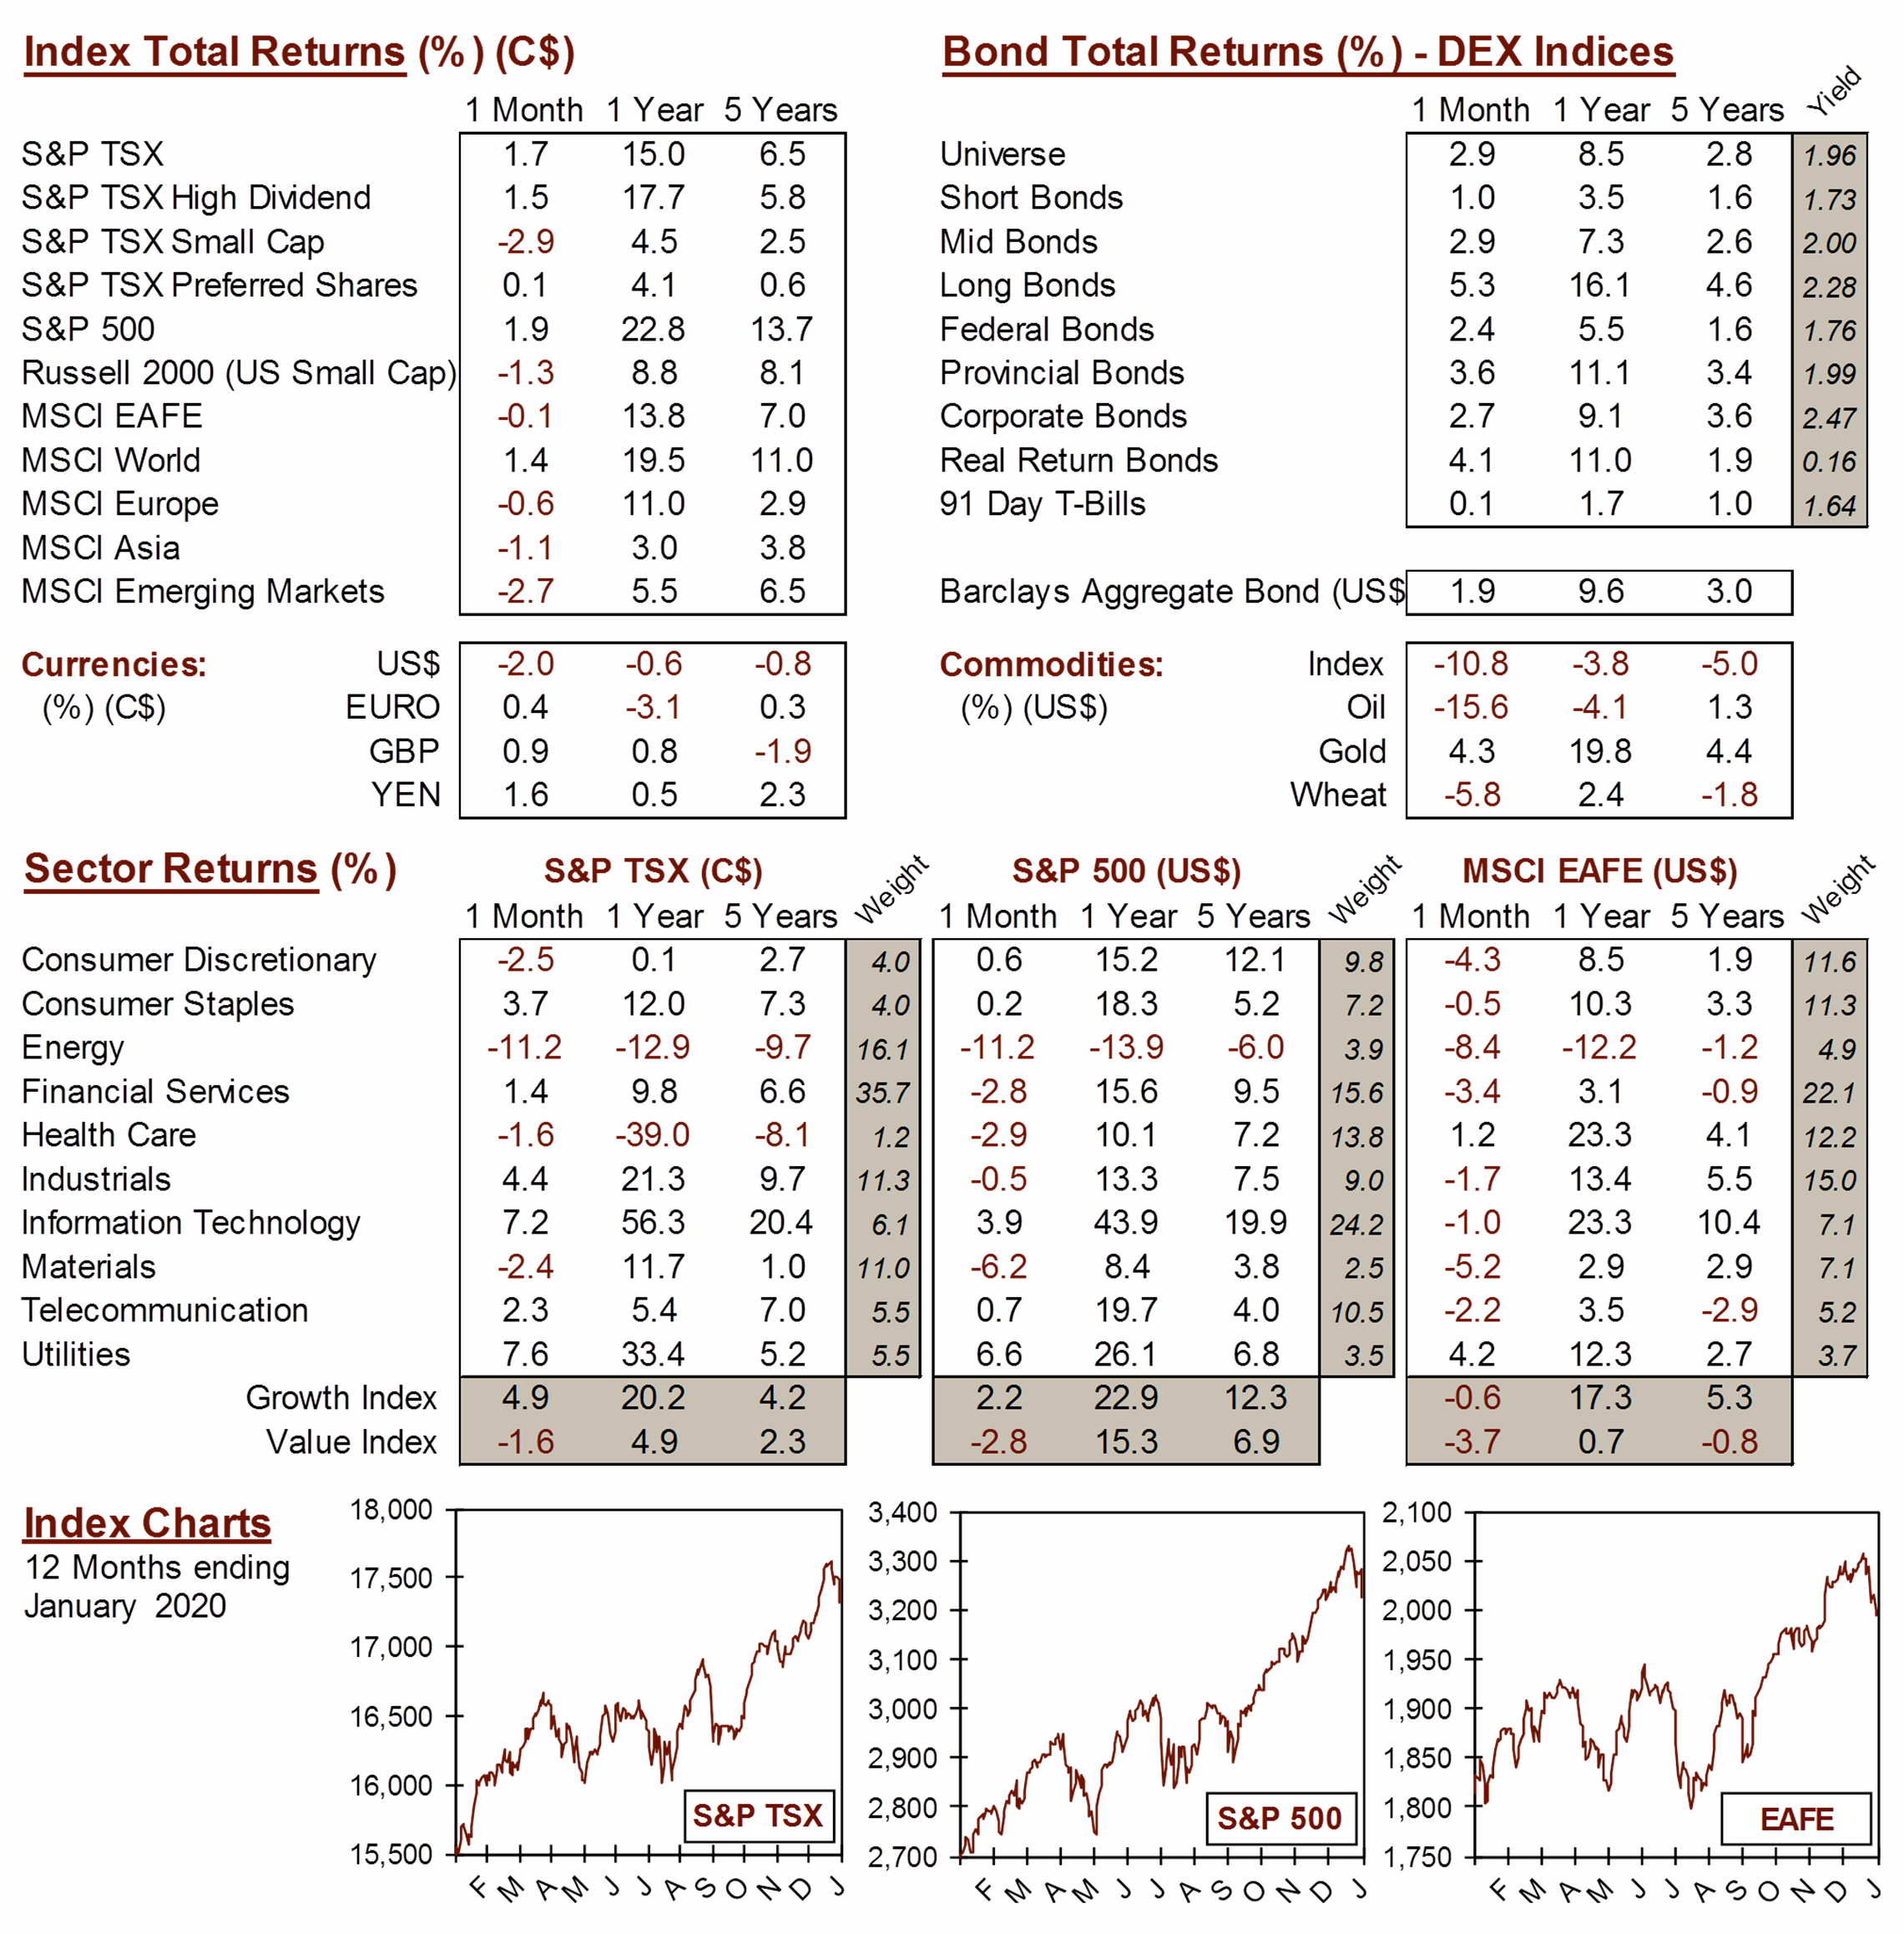
MARKET DATA
This report may contain forward looking statements. Forward looking statements are not guarantees of future performance as actual events and results could differ materially from those expressed or implied. The information in this publication does not constitute investment advice by Provisus Wealth Management Limited and is provided for informational purposes only and therefore is not an offer to buy or sell securities. Past performance may not be indicative of future results. While every effort has been made to ensure the correctness of the numbers and data presented, Provisus Wealth Management does not warrant the accuracy of the data in this publication. This publication is for informational purposes only.
Contact Us
18 King St. East Suite 303
Toronto, ON
M5C 1C4