Knowledge Centre
Equally Weighted vs. Cap Weighted
April 2023
The 1990’s saw the launch of equally weighted indices in the U.S. which have outperformed their traditional cousins, the long standing market capitalization weighted (market cap) indices, by 1.1% per year for the S&P 500 (which was formerly launched in April 2003). Unfortunately, these upstart indices have been slower to catch on and did not really exist in Canada in any material way until October 2011. Where they do exist they have produced meaningful differences that are unique to Canada.
The Canadian S&P/TSX Composite index is a market capitalization weighted index which means companies that have a larger market capitalization carry more weight in the index than smaller firms. The weight of a company in the index is equal to the market capitalization of that company divided by the total market capitalization of all the stocks in the index. In contrast, an equal weighted index gives each stock equal weight regardless of size. An equal weighted portfolio invests the same dollar amount in each company while a cap weighted portfolio would invest more in the “big” companies and less in the smaller ones.
In Canada this leads to a notable disadvantage for the equal weighted indices. They are less concentrated than their market cap counterpart; they buy stocks as they get more expensive and overvalued; and although they are more diversified and have greater exposure to small and mid cap stocks which have higher growth potential, they are also vastly more volatile. However, they do limit the harm of any single tumbling stock. The greater importance placed on smaller cap stocks could be rewarding given the long term outperformance of small cap stocks historically. Unfortunately, it has not worked that way in Canada as it has other regions of the world.
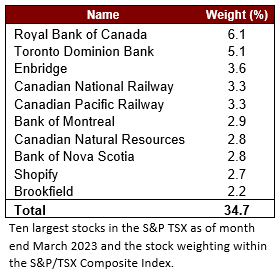
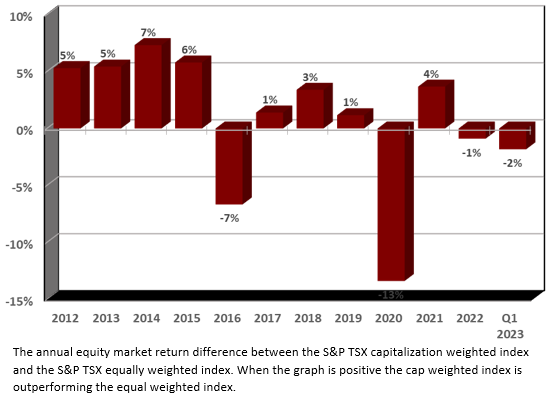
Unlike most of the world, the S&P/TSX Composite Index is one of the most concentrated stock markets around. With the ten largest stocks representing 34.7% of the market’s capitalization. So, the domination of these 10 stocks can have an outsized impact (either positive or negative) to the market’s performance. Unlike the S&P 500 which has underperformed its equally weighting counterpart; in Canada, the market capitalization index has dominated the equally weighted equity benchmark by 1.1% per year since 2012. The chart to the right shows the annual return difference between the market capitalization index and the equally equity index. The list on the left shows the ten largest stocks in Canada and their weighting in the S&P/TSX Composite Index. As a comparison, the average stock weight in the equally weighted equity index is 0.43% (there are currently 234 stocks in the benchmark).
This discrepancy is likely due to the fact that market cap weighted indexes suffer from the flaw that they invest too much in overpriced stocks and too little in discounted stocks, while an equally weighted portfolio owns more bargain stocks and less overpriced ones. The market has a tendency to rely too much on good companies and pays a large premium on the assumption that recent success will lead to long term success.
The issue is that a small group of companies has had an outsized impact on the overall stock market. With the stellar growth of a handful of large cap companies, an index can become even more concentrated with more of the performance and risk driven by an increasingly smaller number of stocks. The Canadian market has become increasingly concentrated in recent years. A small number of companies have been in the driving seat when it comes to the market’s performance. That risk came home to roost in years like 2016 and particularly in 2020 during the COVID-19 pandemic when size was a serious concern. It is very important for investors to understand the concentrated exposures they are taking on.
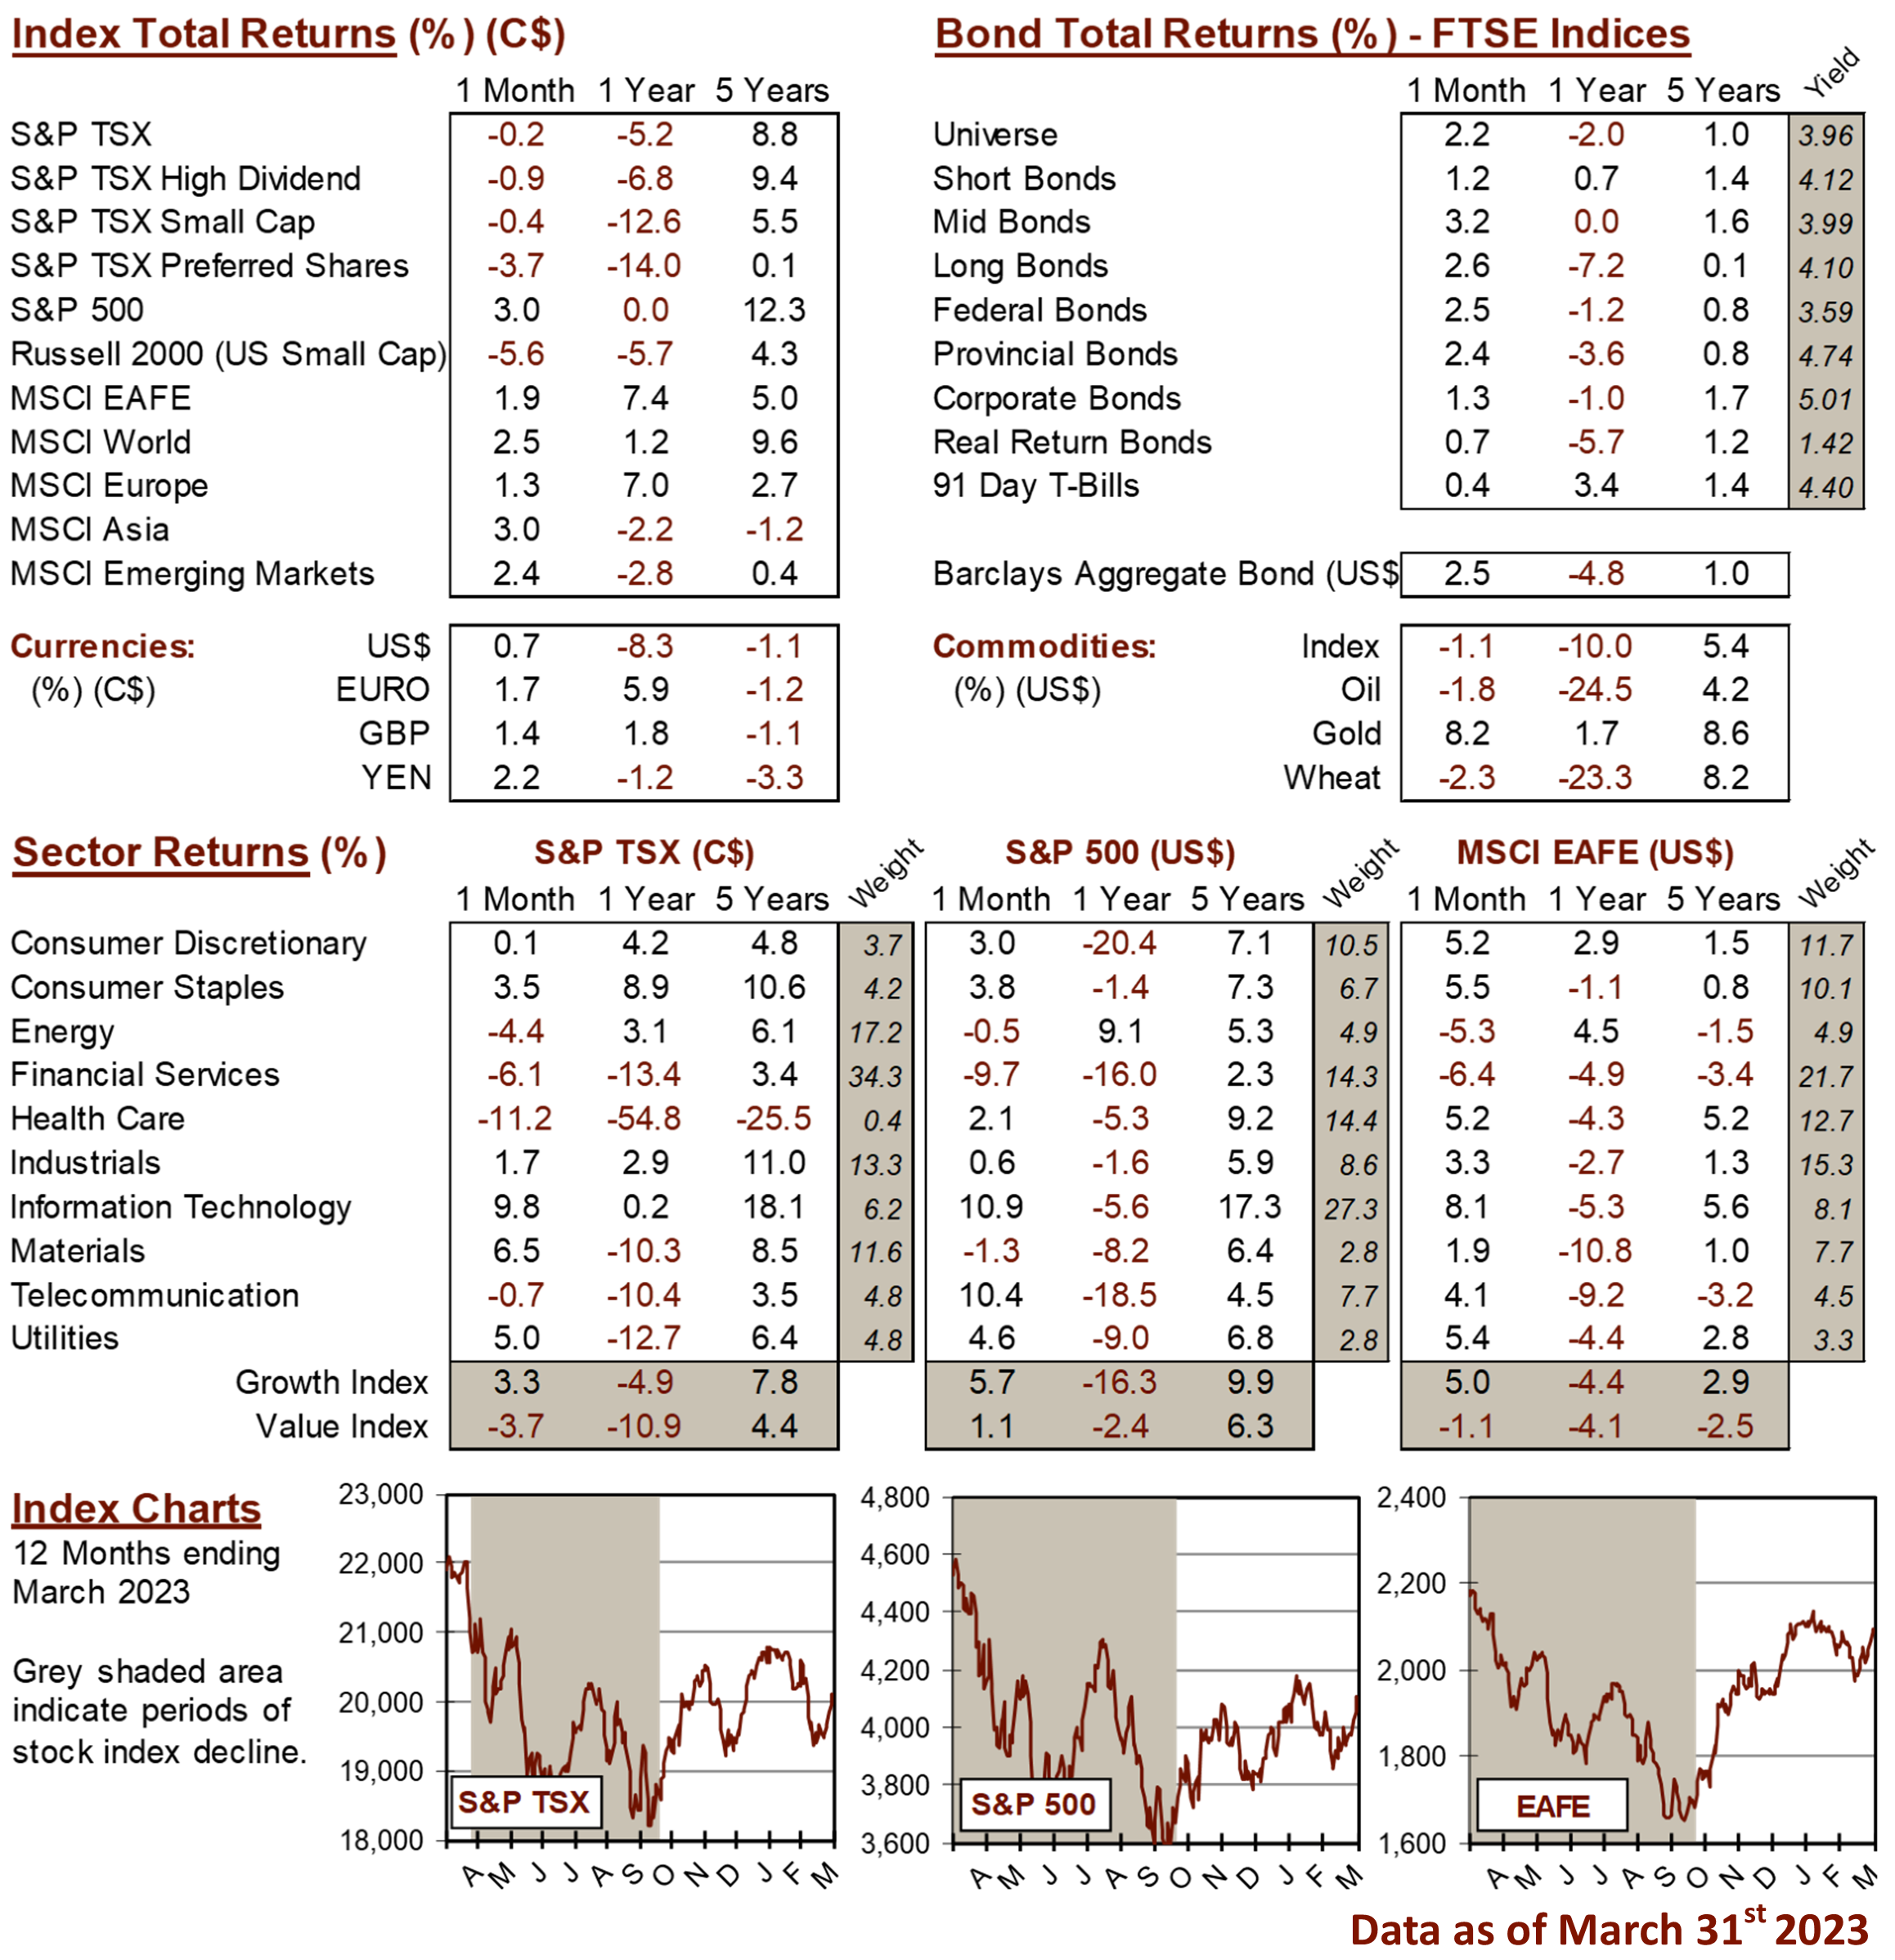
MARKET DATA
This report may contain forward looking statements. Forward looking statements are not guarantees of future performance as actual events and results could differ materially from those expressed or implied. The information in this publication does not constitute investment advice by Provisus Wealth Management Limited and is provided for informational purposes only and therefore is not an offer to buy or sell securities. Past performance may not be indicative of future results. While every effort has been made to ensure the correctness of the numbers and data presented, Provisus Wealth Management does not warrant the accuracy of the data in this publication. This publication is for informational purposes only.
Contact Us
"*" indicates required fields
18 King St. East Suite 303
Toronto, ON
M5C 1C4