Knowledge Centre
Equal vs. Market Cap Weighted Stocks
September 2021
The 1990’s saw the launch of equal weighted indices in the U.S. which have outperformed their traditional cousins, the long standing market capitalization weighted (market cap) indices, by 1.5% per year for the S&P 500. Unfortunately, these upstart indices have been slow to catch on and did not really exist in Canada until December 2005.
The Canadian S&P/TSX Equity Composite Index is a market capitalization weighted index, which means companies that have a larger market capitalization carry more weight than smaller firms. The weight of a company in the index is equal to the market capitalization of that company divided by the total market capitalization of all the stocks in the index. In contrast, an equal weighted index gives each stock equal weight, regardless of size. An equal weighted portfolio invests the same dollar amount in each company, while a cap weighted portfolio would invest more in the “big” companies and less in the smaller ones.
There are notable advantages for the equal weighted indices as they are less concentrated than their market cap counterpart, they avoid buying stocks as they get more expensive and overvalued, they are more diversified and they have greater exposure to small and mid cap stocks which have higher growth potential. As well, they limit the harm a single tumbling stock can do. The greater importance placed on smaller cap stocks can be rewarding given the long term outperformance of small cap stocks historically.
Of course, there are disadvantages for equal weighted indices as well. Rebalancing to maintain equal weights means higher turnover and additional transaction costs which on average are more than five times greater than market cap indices. They are not as tax efficient, tend to be riskier as more money is invested in mid and small cap stocks that have lower dividend yields, earnings, and cashflow growth.
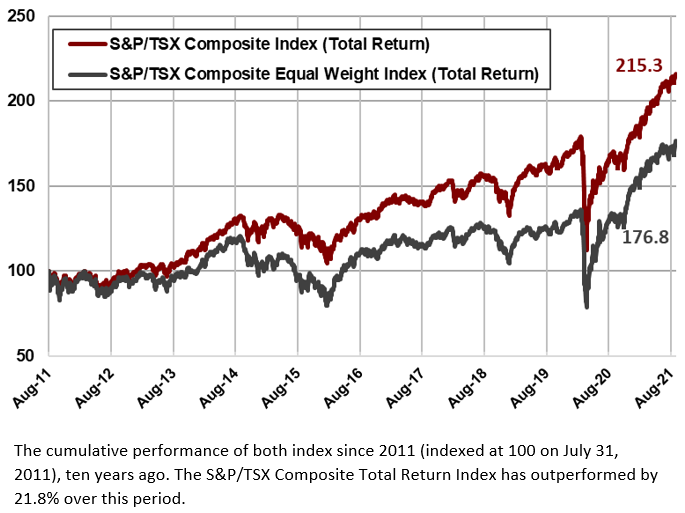
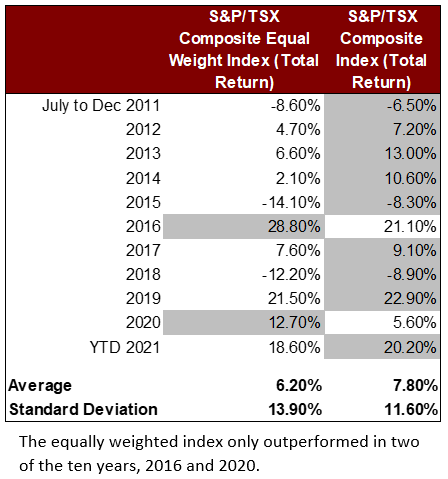
In Canada, equal weighted portfolios made up of all the stocks in the S&P/TSX index have underperformed the index itself for the past 10 years by 1.6% per year or 21.8% over the whole period. Over this timeframe, one of the most volatile of the past 100 years, the equally weighted portfolio only outperformed (as shown in the table below) in two years, 2016 and 2020.
Of course nothing stays on top forever but it could be argued that the cap weighted version is the better bet for long term performance. There are several reasons why the equal weighted version of the S&P/TSX Index will lag the market over time: firstly, the equal weight version of the index is constantly selling portions of its biggest winners and buying additional shares of its biggest losers so that all holdings remain at an equal weight which is an anti-momentum or contrarian bet; secondly, because the equal weight index is more heavily exposed to the small cap sector it will be riskier than the cap weighted version; in fact it is over 10% more volatile.
The market has a tendency to rely on good companies and pays a large premium on the assumption that recent success will lead to long term success. Equal weighting is a contrarian strategy that exploits the reversal in stock prices and eliminates some of the problems with market capitalization weighted indices. However, over the past 10 years it has under performed the market cap weighted index by 21.8% which is very meaningful to long term investors.
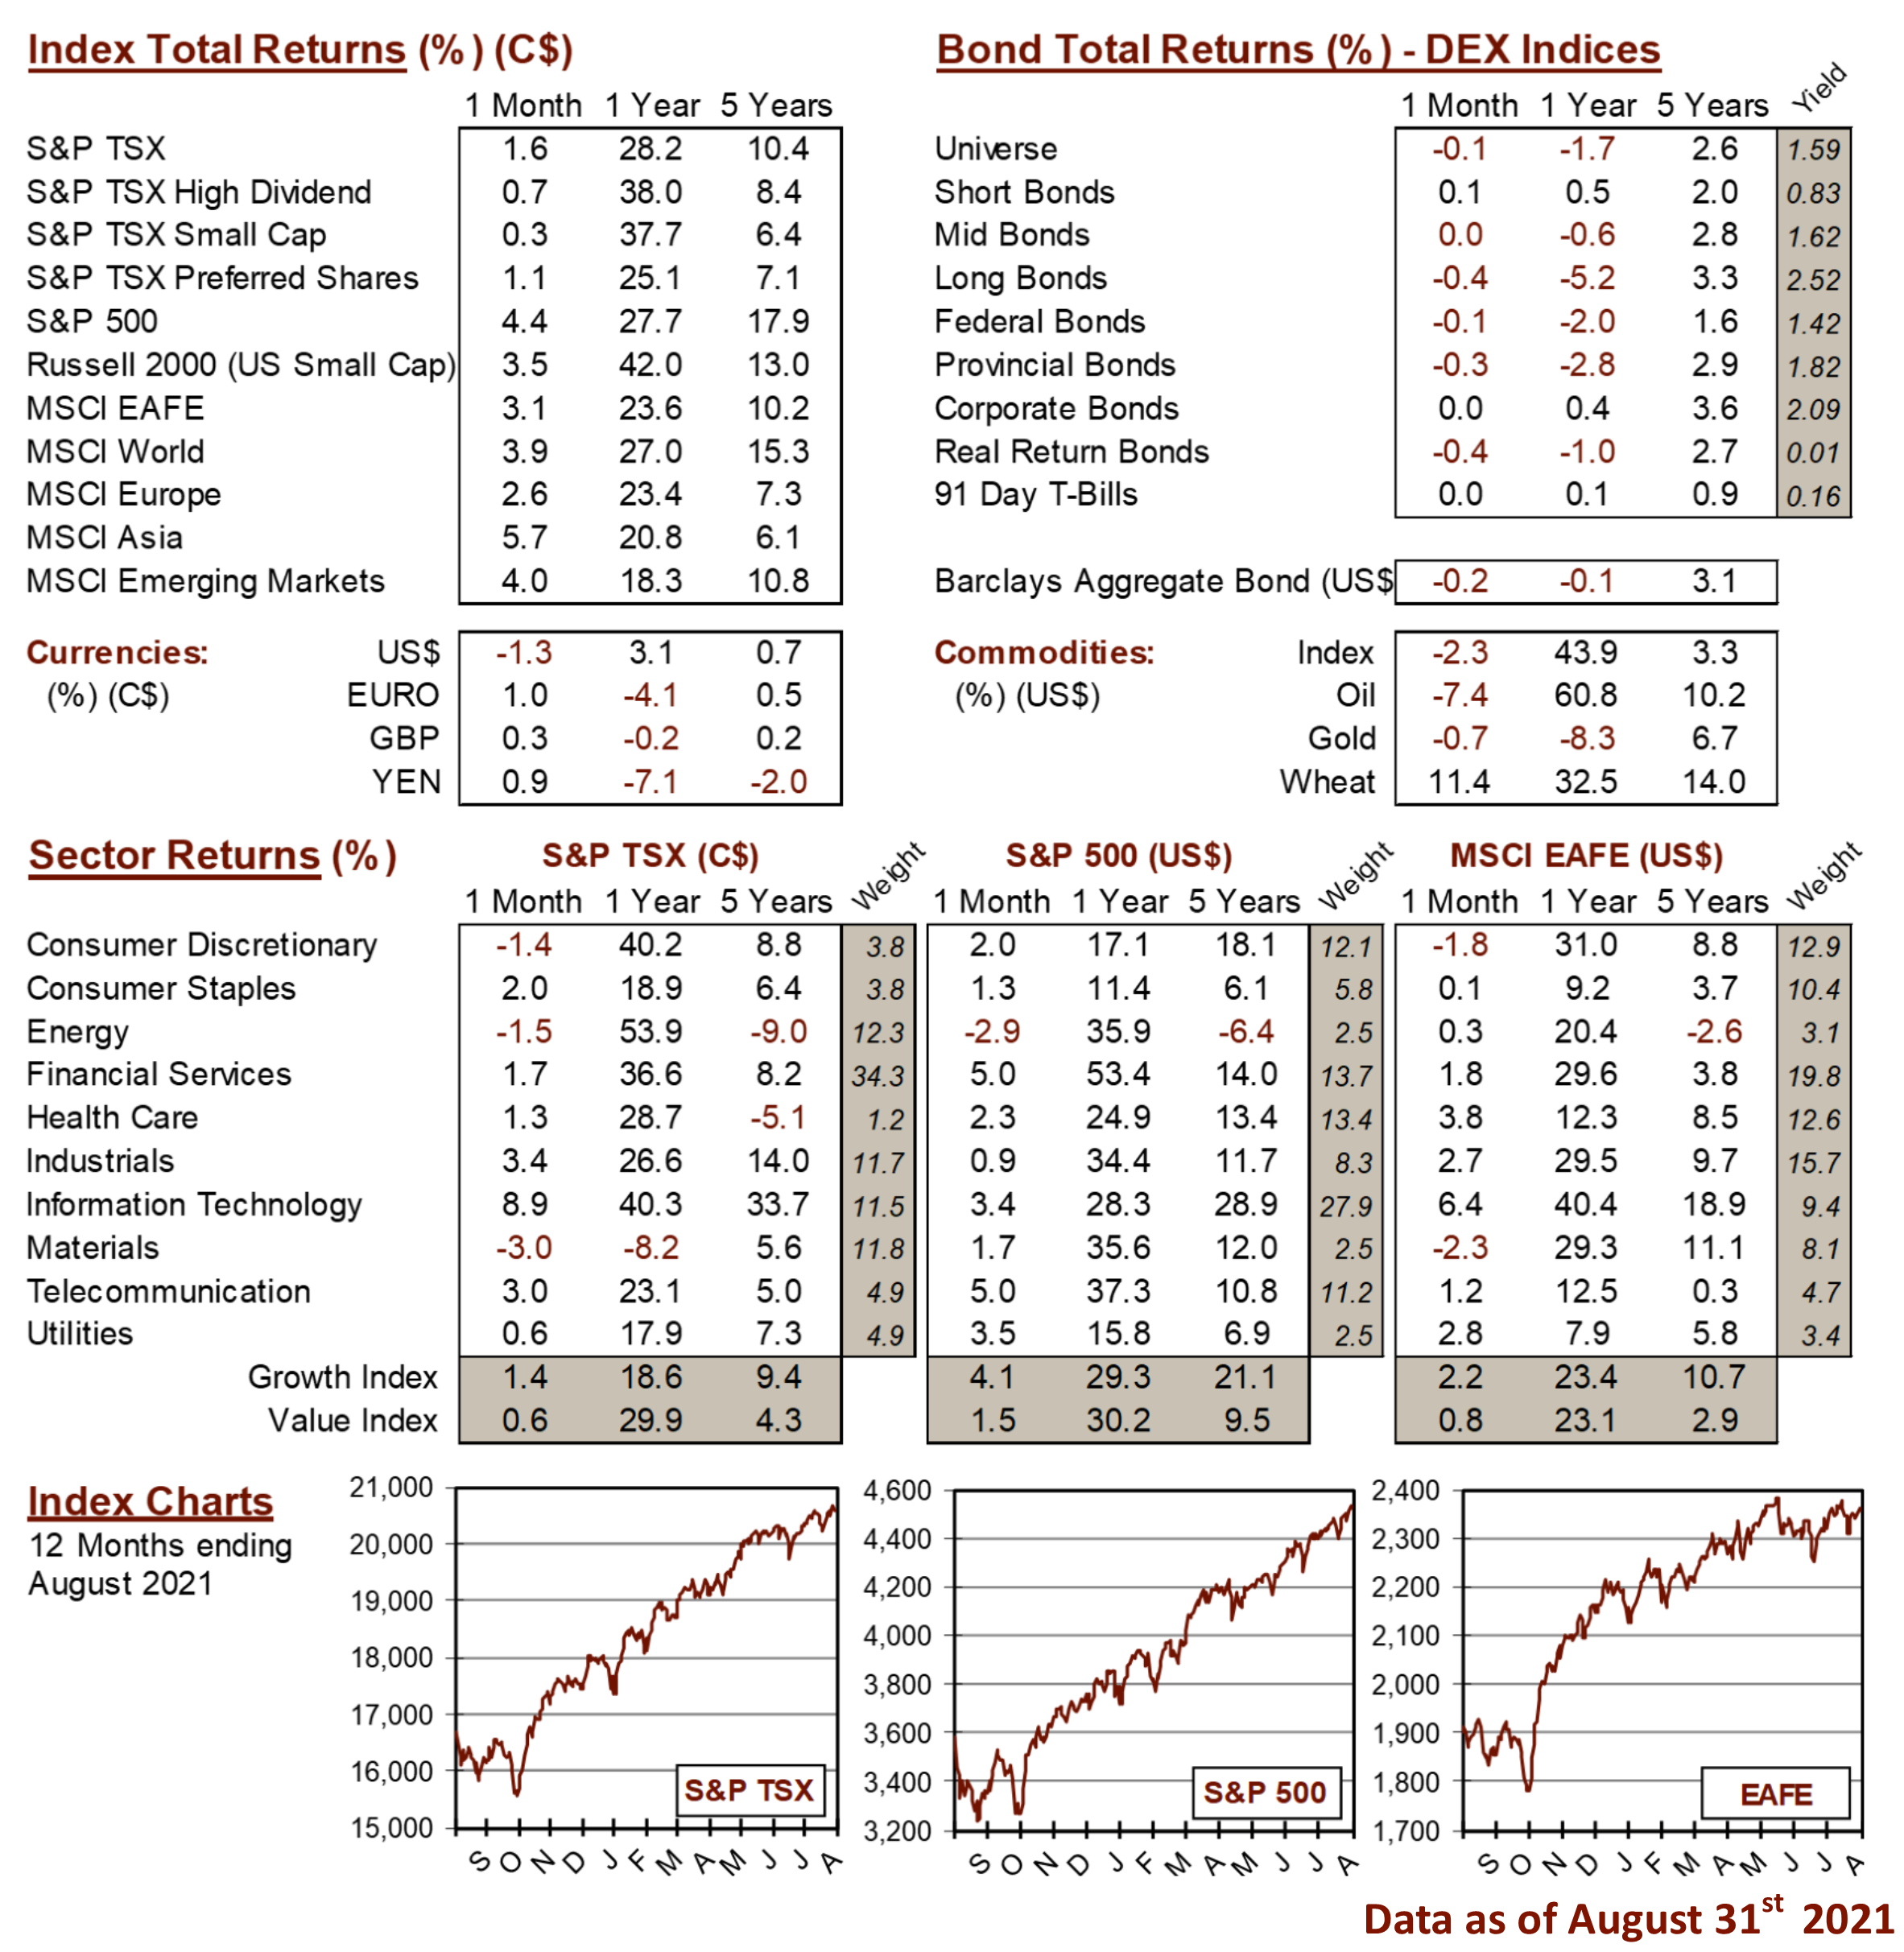
MARKET DATA
This report may contain forward looking statements. Forward looking statements are not guarantees of future performance as actual events and results could differ materially from those expressed or implied. The information in this publication does not constitute investment advice by Provisus Wealth Management Limited and is provided for informational purposes only and therefore is not an offer to buy or sell securities. Past performance may not be indicative of future results. While every effort has been made to ensure the correctness of the numbers and data presented, Provisus Wealth Management does not warrant the accuracy of the data in this publication. This publication is for informational purposes only.
Contact Us
18 King St. East Suite 303
Toronto, ON
M5C 1C4