Knowledge Centre
Déjà Vu on the Way?
April 2020
History is a fickle guide. It has a way of repeating itself (although never in exactly the same way) and it could be about to deliver a welcome reprieve from the Canadian stock market turmoil in the form of a potential turning point in what has been a one-sided slide due to the Covid-19 virus. Investors who are fearful should keep in mind what legendary long-term investor Warren Buffet has long maintained; investors should, “be greedy when others are fearful and be fearful when others are greedy.”
Investors’ most discussed concern is whether or not we are past the worst or can we expect further downturns? It is impossible to predict the stock market bottom from the current malaise. However, to feel confident that the stock market has bottomed, three criteria must be met:
• The viral spread must begin to slow, so that the ultimate economic impact of the virus and containment efforts can be properly understood.
• There must be evidence that “extraordinary measures” taken to support the Canadian economy are sufficient.
• Investor sentiment and positioning must bottom out.
Eventually confidence in the market will be restored and investors will step forward to take advantage of the lows but markets will continue to be volatile. The timing of the recovery cannot be exactly predicted and may not be particularly evident until after the fact.
Bear markets normally occur in three stages. The first is during a positive run when a few prudent investors recognize that despite the overwhelming bullishness, things will not always be rosy. The second is when most investors recognize the economy is deteriorating, and the third occurs when the consensus is that things can only get worse (although given the furious speed of this correction these three stages all occurred in the blink of an eye). On the other side, a bull market also goes through three stages. Initially only a few forward-looking investors begin to believe things will get better. In the second phase the majority of investors come to realize that improvement is underway and the final stage is when most everyone is sure markets will get better. Bull markets begin when investors become increasingly forward looking.
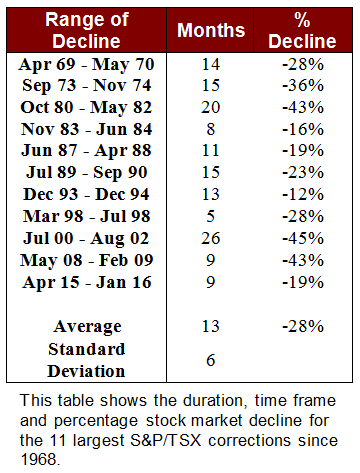
Determining the bottom is every investor’s dream. History does provide a range of dates of when rebounds have occurred in the past and the table to the left shows the time frame, duration and level of decline for the previous 11 largest Canadian stock market corrections since 1968. The average length of these bear markets is 13 months, with a standard deviation of 6 months. While these decline metrics appear normal for traditional economic correction-based situations; the current market downturn was the fastest decline of 30% or more in the past 100 years – 22 days! Given the speed of this decline and the potential for clear indicators of bottoming emerging; this recovery will likely begin much faster.
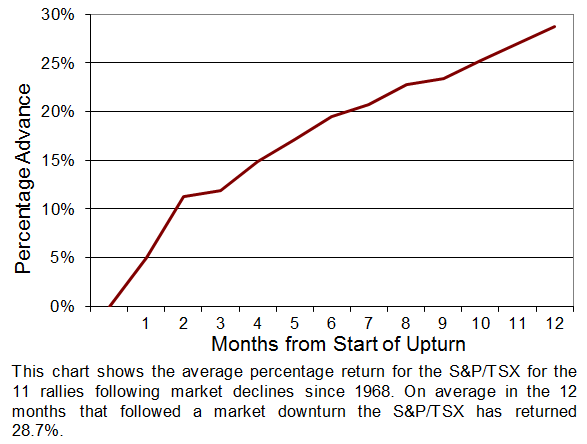
Whatever the actual date of the current selloff’s bottom, it will occur and when it does a rally will ensue. Just as there have been 11 bear markets, they have been followed by 11 bull markets. By using month end data for these 11 rallies in the S&P/TSX index from 1968, the above right chart shows that on average the S&P/TSX index returned 28.7% in the 12 months following the market bottom. The recoveries have been as little as 12.9% and as large as 79.0%.
Even though there is uncertainty about what lies ahead it is hard not to feel that the worst is close to being over. However, caution must be taken and not swept away on a tide of optimism. History has also shown that rallies emerging from the depths of bear markets are often followed by a period of uncertainty. Stock markets tend to temporarily decline after the initial rebound, as the market digests what it gained.
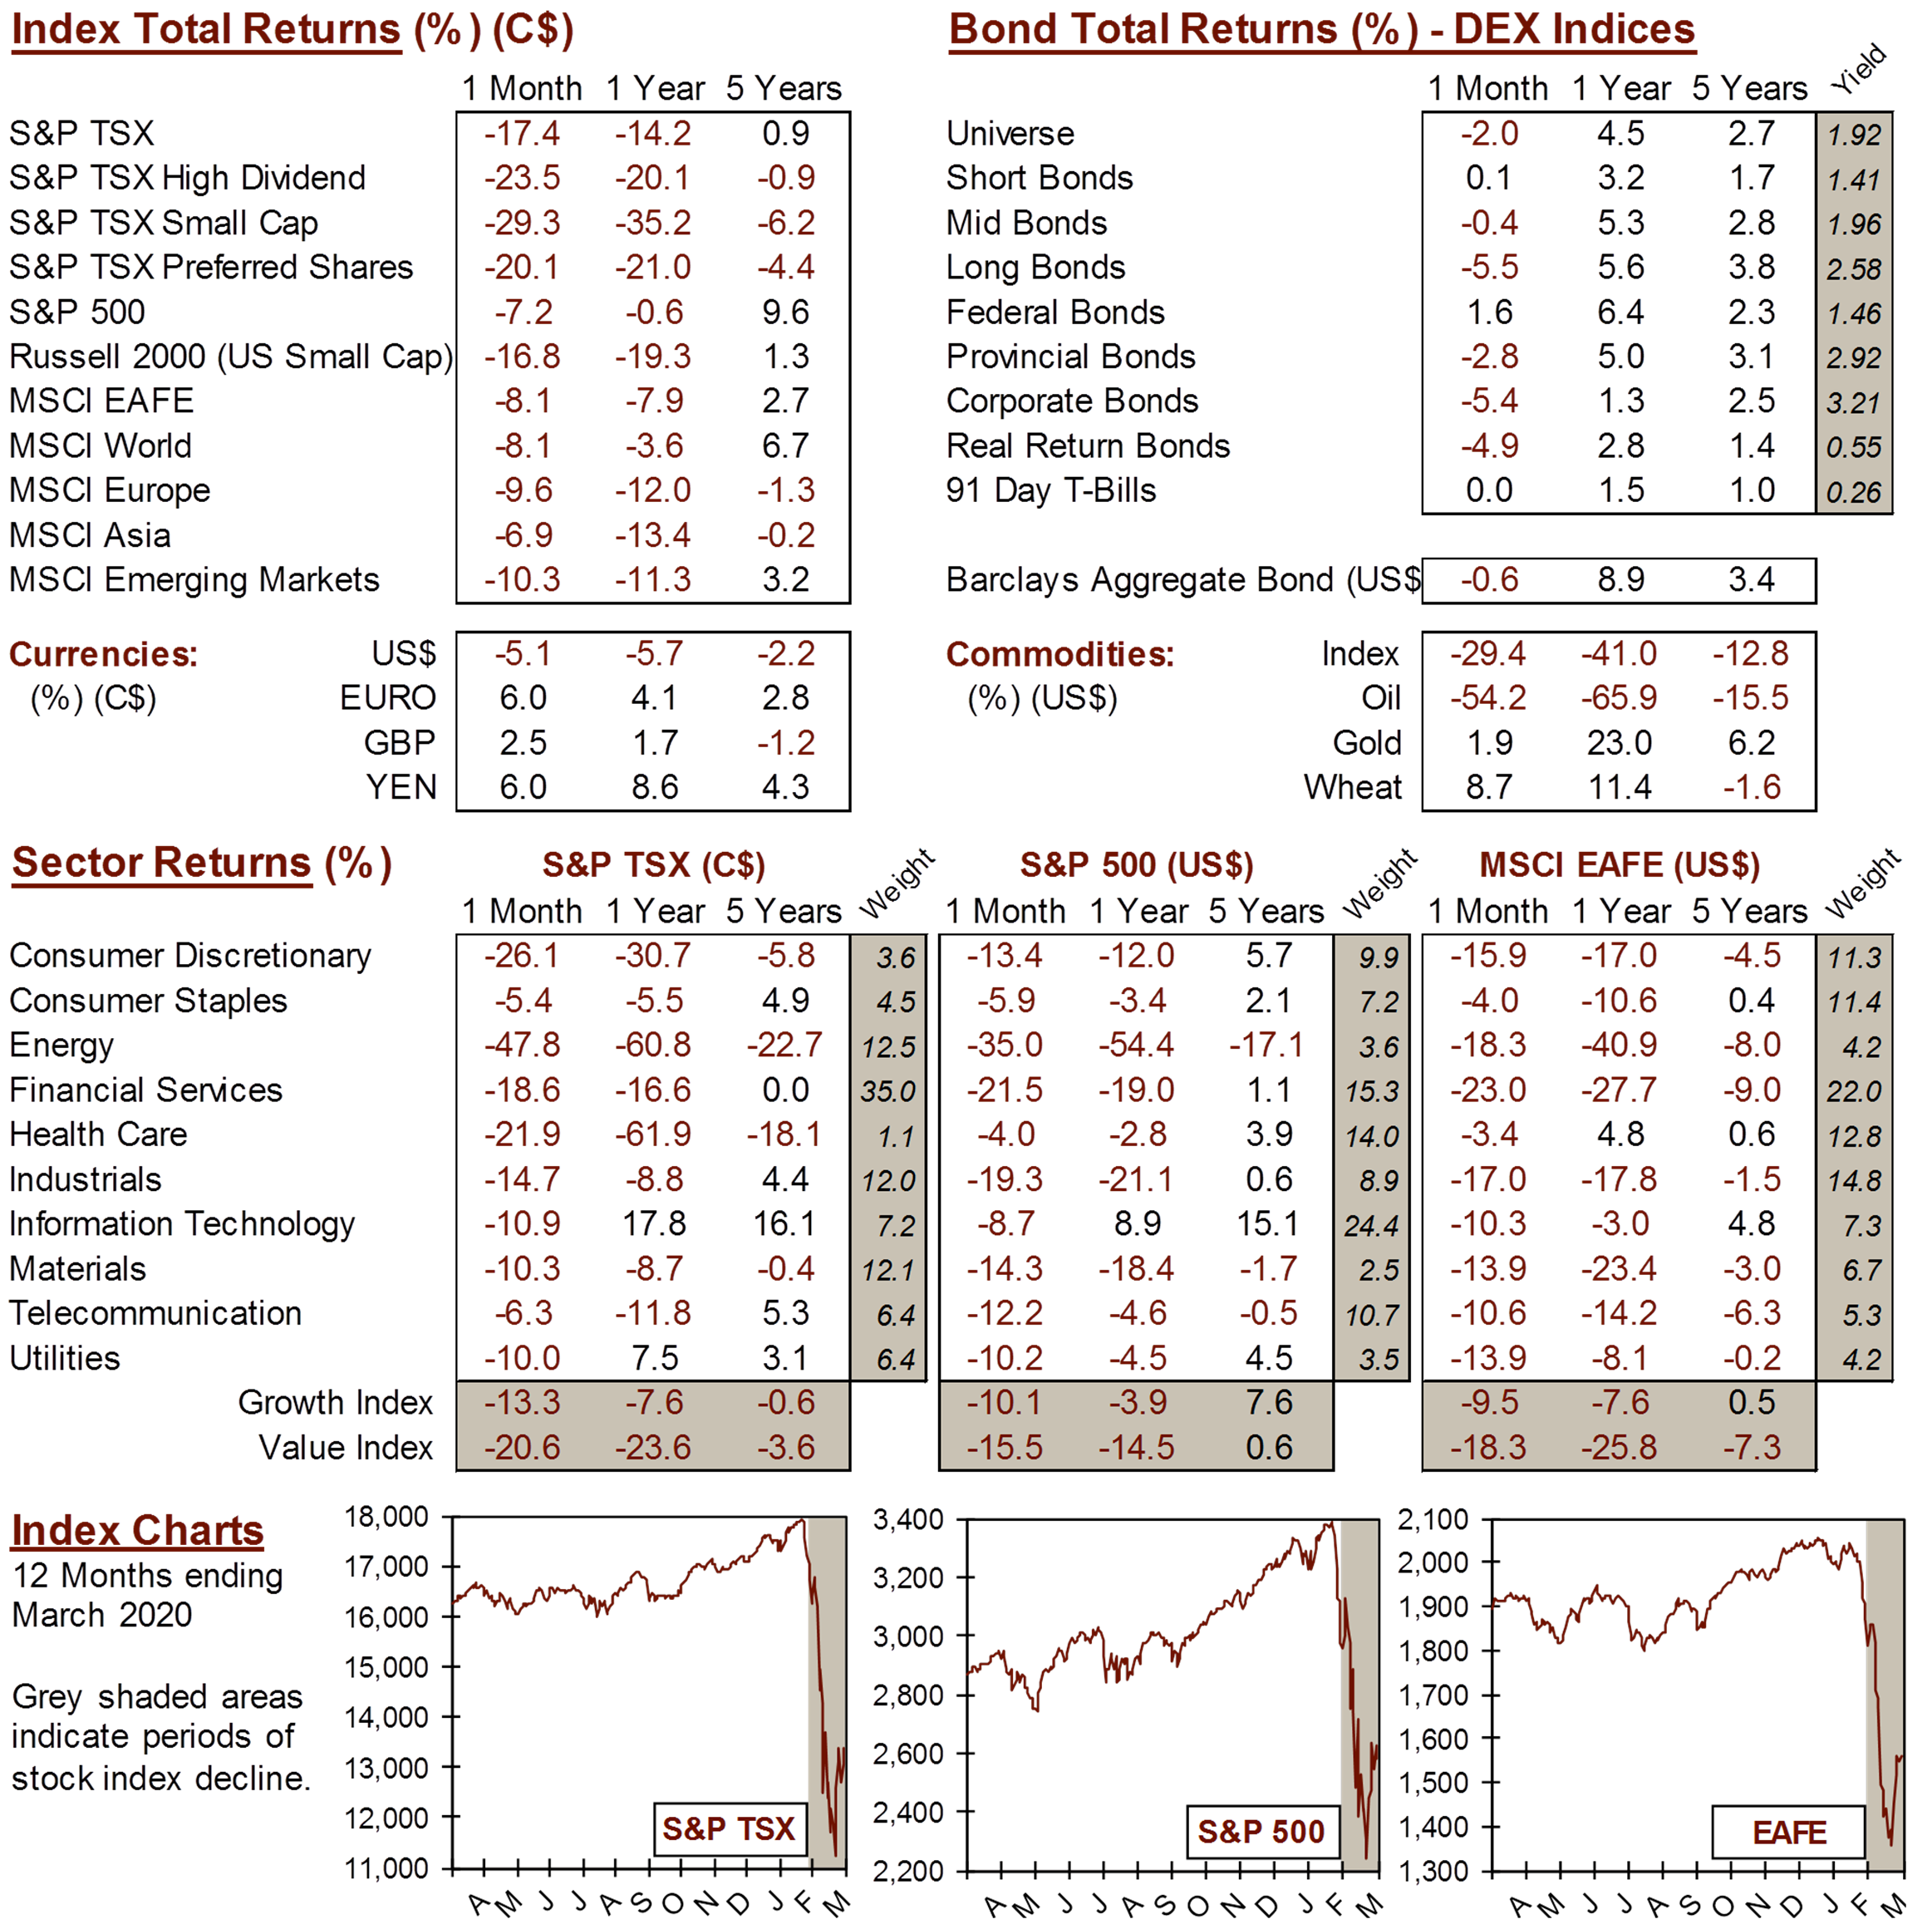
MARKET DATA
This report may contain forward looking statements. Forward looking statements are not guarantees of future performance as actual events and results could differ materially from those expressed or implied. The information in this publication does not constitute investment advice by Provisus Wealth Management Limited and is provided for informational purposes only and therefore is not an offer to buy or sell securities. Past performance may not be indicative of future results. While every effort has been made to ensure the correctness of the numbers and data presented, Provisus Wealth Management does not warrant the accuracy of the data in this publication. This publication is for informational purposes only.
Contact Us
18 King St. East Suite 303
Toronto, ON
M5C 1C4