Knowledge Centre
Big Bad Bear Market
December 2015
If stock markets around the world had fallen by more than 50% from their peak, investors would have been in quite a tizzy with the panic of collapse and catastrophe running rampant. But it is not stocks that are in a nasty bear market, it is commodities. They are far less important from an investment perspective in many parts of the world, 9.7% in the U.S. and 11.6% internationally based upon their stock market weighting. However, in major commodity-producing countries such as Canada where commodities currently represent 29.1% of the stock market (down from a peak of more than 50.0% at the height of the commodity cycle), the drop in prices means job losses and currency devaluation.
While the decline in commodity prices has foreshadowed broader concerns about the global economy, the principal question is whether the fall in commodity prices will be good news (stimulate economic growth like a tax cut) or bad news (further weaken already depressed economies). This question comes down to one nation, China. It was soaring Chinese demand for raw materials that caused the great bull market in 1999 and significantly contributed to its demise as growth slowed to its weakest pace in 25 years. Record demand through the early 2000s has now left the world awash with oil, natural gas, iron ore and copper.
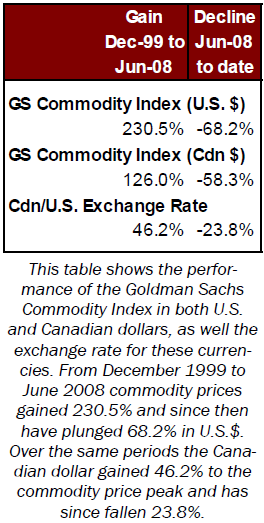
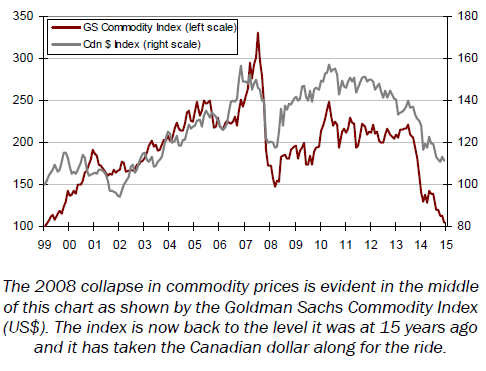
The 2008 collapse in commodity prices is evident in the middle of this chart as shown by the Goldman Sachs Commodity Index (US$). The index is now back to the level it was at 15 years ago and it has taken the Canadian dollar along for the ride.It is almost like the twenty-first century never happened from a commodity pricing point of view. As the accompanying chart and data show, the so called commodity super cycle is pretty much back to where it started. Both the Goldman Sachs Commodity Index (one of the most widely recognized investable commodity benchmarks) and Canadian/U.S. dollar exchange rate were indexed at 100 on December 31, 1999 (using month end data) to show how both commodities (in U.S. dollar terms) and our currency have fared over the past 15 years. It is not a pretty picture. From the start to its peak in June 2008, commodity prices gained 230.5%. Since then it has been downhill, despite a small rebound from 2009 to 2011, as prices plunged 68.2%. At the same time the Canadian dollar had gained 46.2% at the commodity price peak and has since fallen 23.8%.
The much anticipated U.S. interest rate hike (the first since 2006) is expected in December and has helped push up the U.S. dollar 13.1% this year, which has only added to the woes of commodities since they are mostly priced in U.S. dollars. However, since the Canadian dollar has fallen so sharply against the U.S. dollar since the peak in commodity prices, it has helped to ease the fall for many producing companies. Commodity production costs have gotten cheaper so many companies are still making some money. This might have deferred some of the pain but it will also delay any recovery. The incentive to cut supply is less intense so it will make it harder for the marketplace to mop up excess raw materials anytime soon. But eventually the market will correct itself. It always does.
While the global economy is in far better shape now than it was in the aftermath of the 2008 recession, the momentum for commodities is clearly negative with potentially more weakness expected in the future. This could have negative ramifications for the Canadian dollar as well, since it is still 11.4% above where it was when the commodity cycle started in 1999. On the other hand a weaker dollar will likely be good for exporters since the Canadian economy is dominated by foreign trade. This will likely be very good for the stock market, eventually.
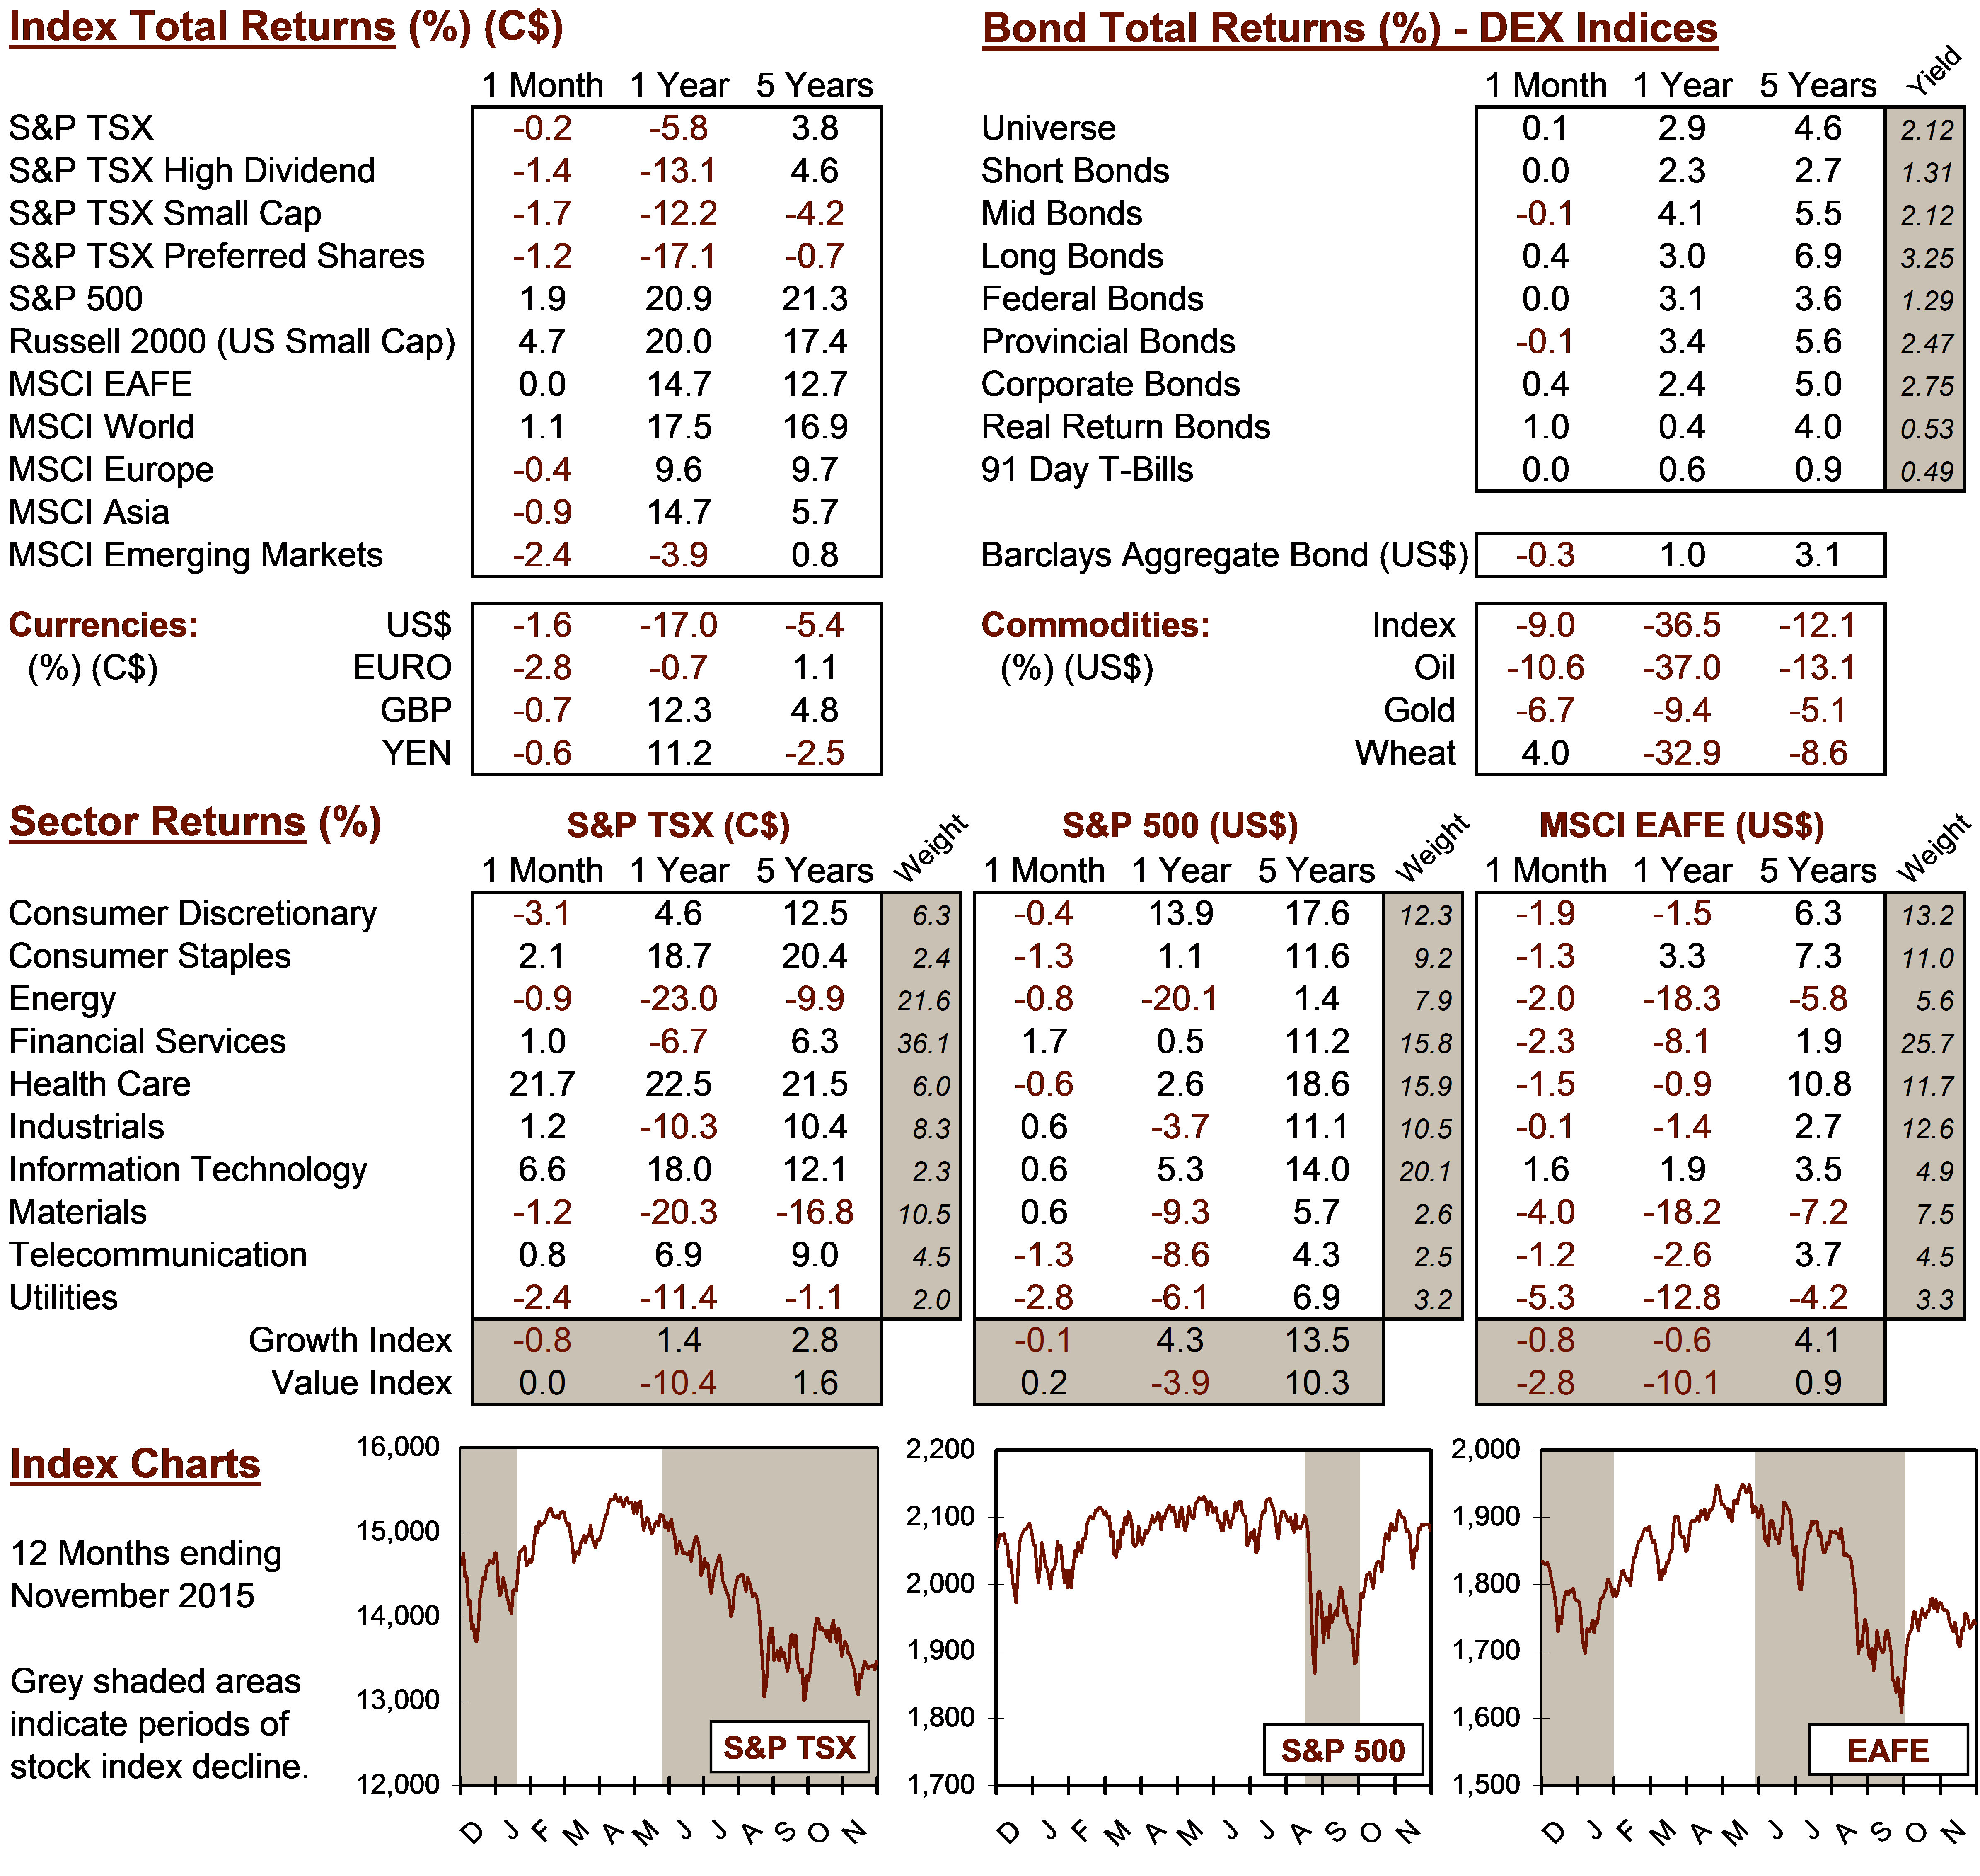
MARKET DATA
This report may contain forward looking statements. Forward looking statements are not guarantees of future performance as actual events and results could differ materially from those expressed or implied. The information in this publication does not constitute investment advice by Provisus Wealth Management Limited and is provided for informational purposes only and therefore is not an offer to buy or sell securities. Past performance may not be indicative of future results. While every effort has been made to ensure the correctness of the numbers and data presented, Provisus Wealth Management does not warrant the accuracy of the data in this publication. This publication is for informational purposes only.
Contact Us
18 King St. East Suite 303
Toronto, ON
M5C 1C4