Knowledge Centre
First Five Days of January
February 2023
There are many investment indicators, anomalies and down right myths that influence investors strategies or trading patterns. If there is one thing the financial world will never run short on, it is opinions. No matter where you turn, you will find all the investing guidance you could ever want but unfortunately, in most cases, the end result will likely be less than rewarding. That is why it is always refreshing to come across an indicator that does appear to have a high degree of validity and successful guidance.
The First Five Days of January indicator, which goes back to 1970 in the U.S., is routinely dusted off each year to give investors some clues as to how the rest of the year will pan out. For investors who are looking for more clarity, the first five trading days of January often acts as an early warning system as to how the rest of the year will unfold. But how has this indicator worked in Canada?
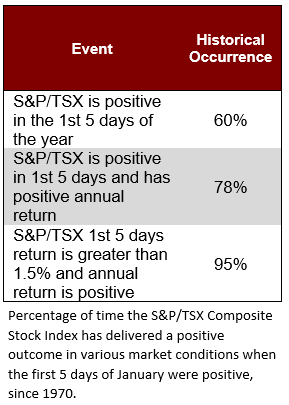
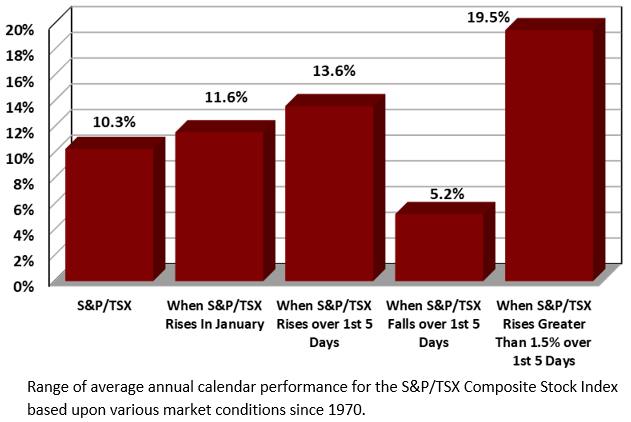
The first thing to remember is that the stock market in Canada (as represented by the S&P/TSX Composite Stock Index) has achieved positive performance in 33 of 53 years since 1970, or 72% of the time. On a calendar year basis, it generated an average return of 10.3%. Unfortunately, only 60% of the time over those 53 years did the first five trading days of each year generate positive results, which is not overly exciting. However, where it starts to get more interesting is when you analyse the average annual performance for the year when the first five trading days of the year earned positive gains versus losses. When the S&P/TSX Index is positive in the first 5 days of the year, so is the annual return 78% of the time with an average of 13.6%. Conversely, when the first five days of the year are negative the average annual return is only 5.2%. This divergence is highly significant.
Even more interesting is whenever the Canadian stock market rises by more than 1.5% over the first five trading sessions of January, then the market is higher for the full year more than 95% of the time. This has occurred 19 years since 1970 (there was only one year where the annual return was negative which was in 1994 when the markets return was only -0.2%). Overall, the average annual return was 19.5% (as shown in the chart to the right). Certainly, this could be the harbinger of good returns going forward. And not to throw too much wood onto the fire, but the S&P/TSX Index rose 2.4% over the first five sessions of 2023. Historically, when the stock market has returned this level of performance, the annual returns have been a staggering 23.4% on average.
At the end of the day, the first five days of January are just an indicator of what could happen and not a guarantee of success. Obviously, this year has gotten off to a good start with Canadian stocks climbing 7.4% in January. Still, this indicator’s predictive ability could just be coincidental given that stocks rise most years. To be sure, such a rule is likely not significant enough on which to base investment decisions because the phenomenon may just be coincidental. However, many investors can take comfort that when this indicator flashes positive signals and given its strong track record then the likelihood that the Canadian stock market will rise this year are very good.
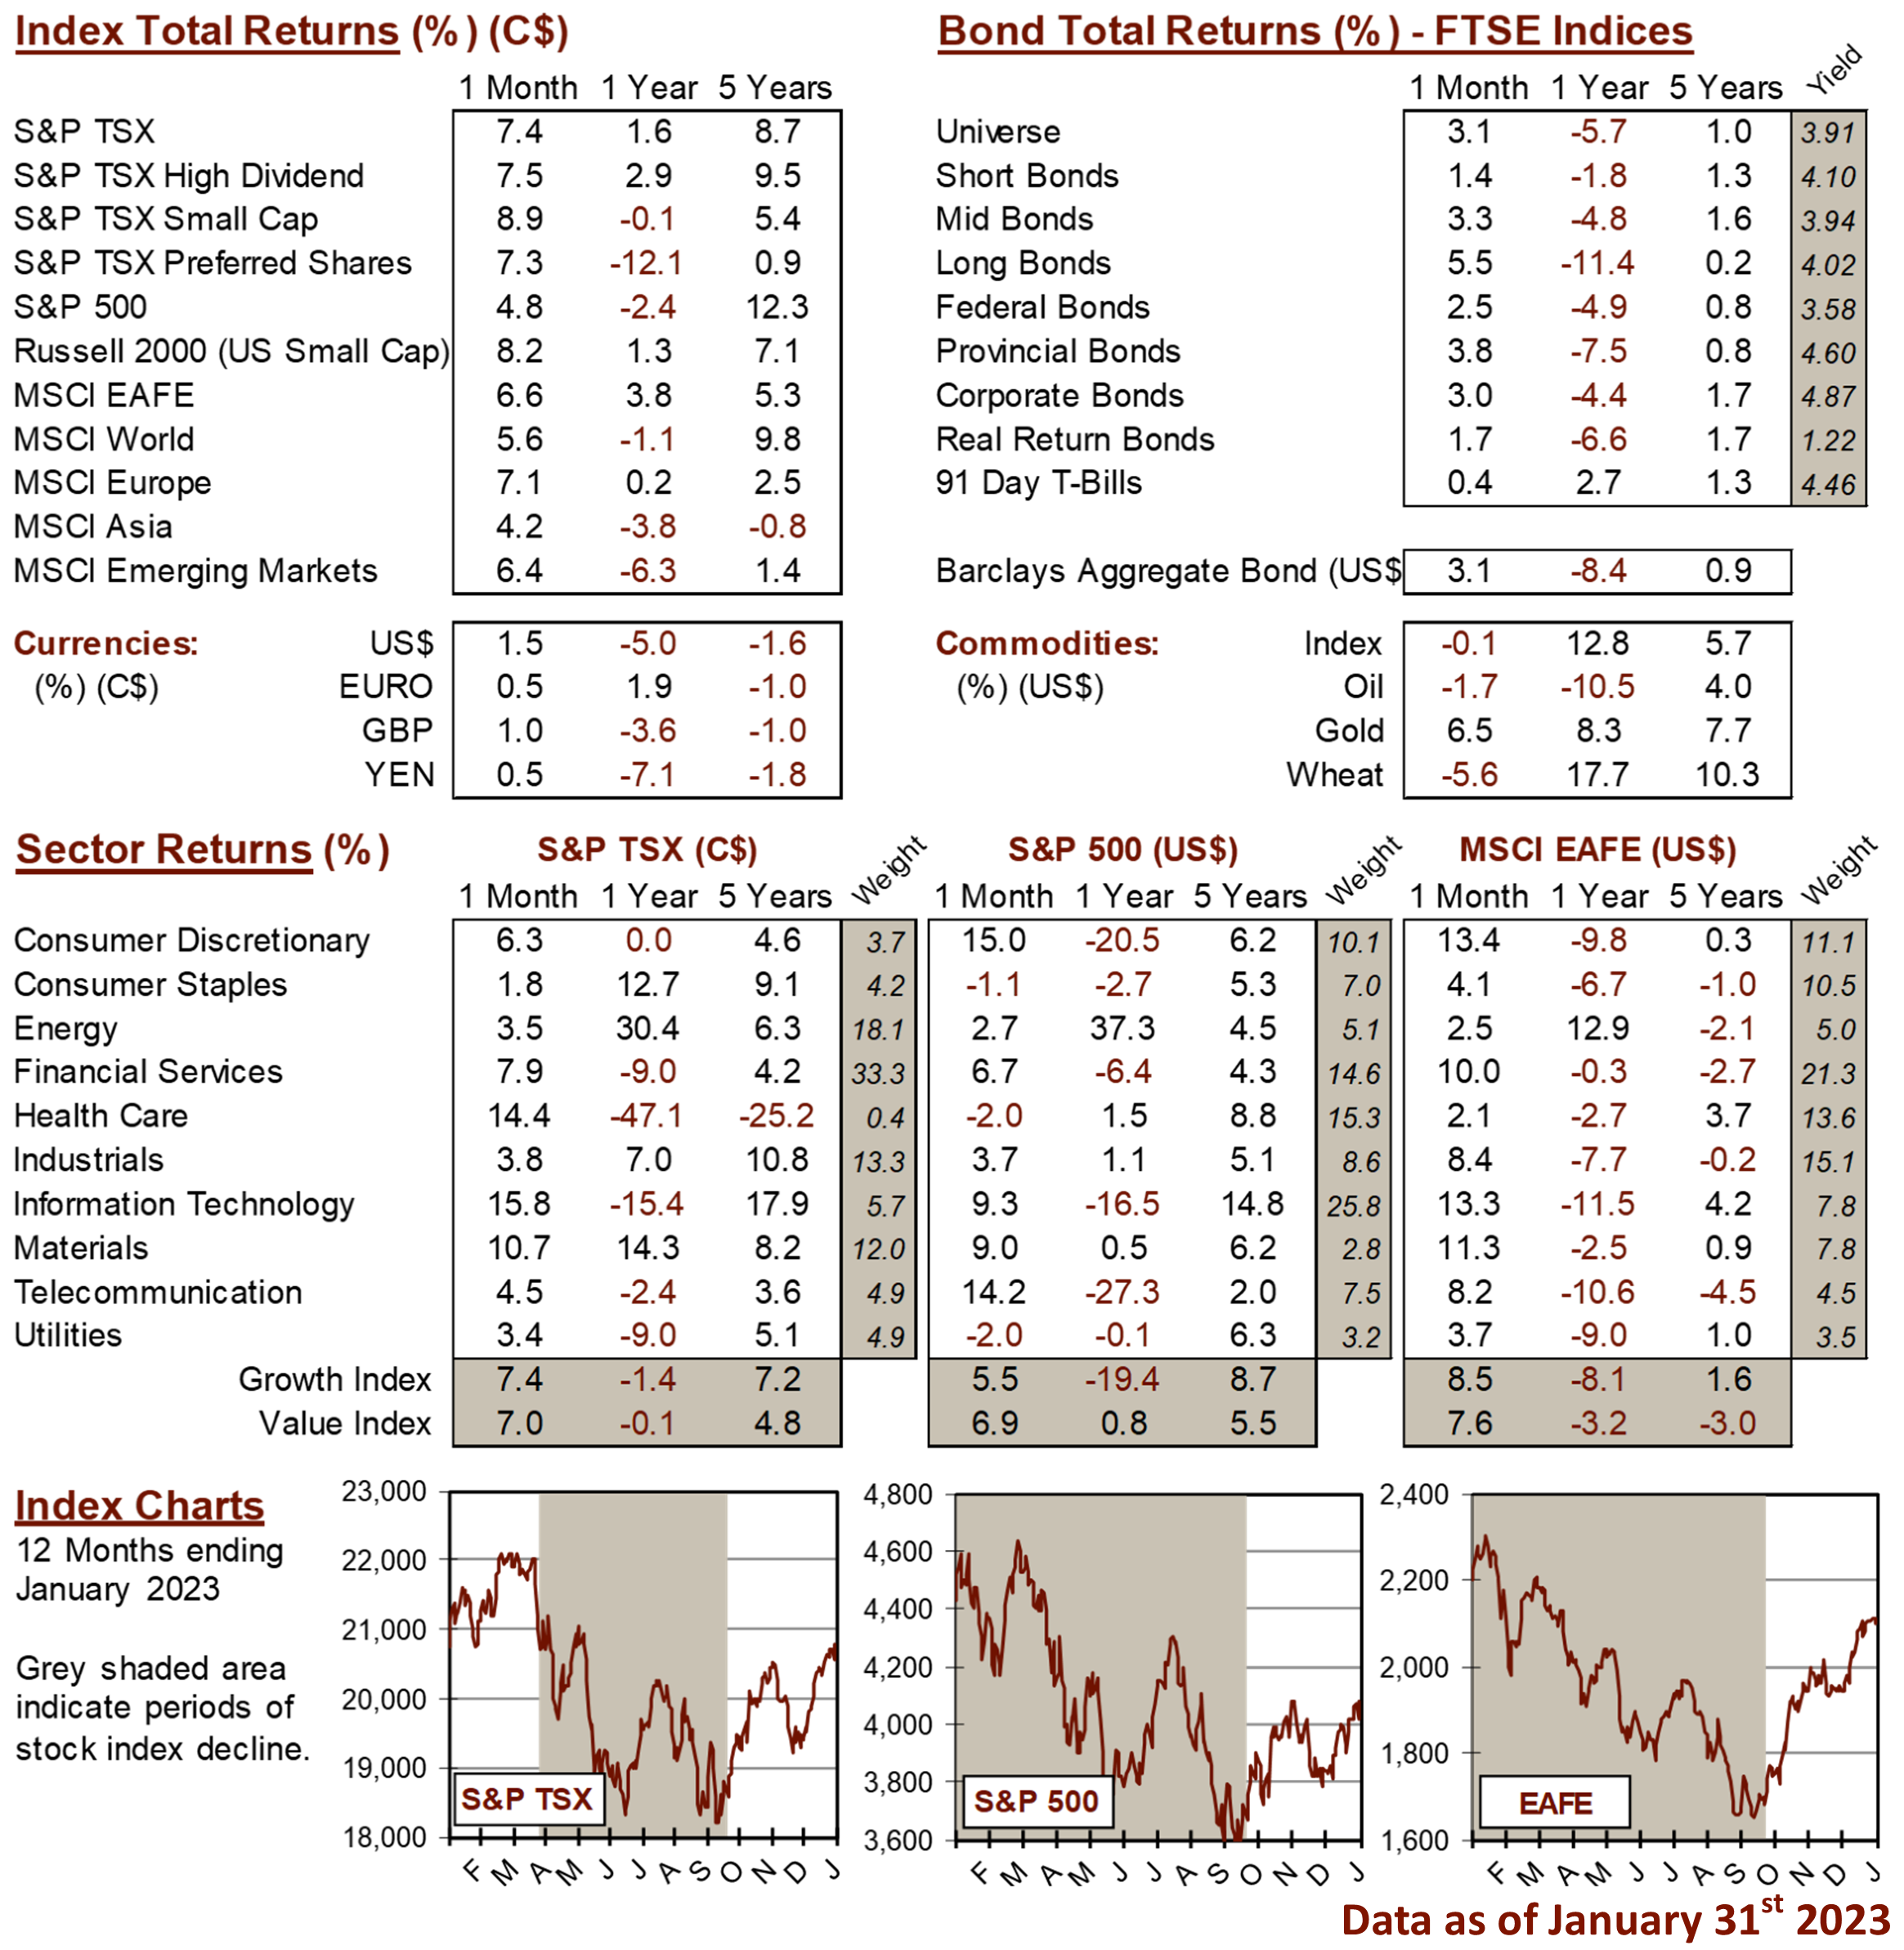
MARKET DATA
This report may contain forward looking statements. Forward looking statements are not guarantees of future performance as actual events and results could differ materially from those expressed or implied. The information in this publication does not constitute investment advice by Provisus Wealth Management Limited and is provided for informational purposes only and therefore is not an offer to buy or sell securities. Past performance may not be indicative of future results. While every effort has been made to ensure the correctness of the numbers and data presented, Provisus Wealth Management does not warrant the accuracy of the data in this publication. This publication is for informational purposes only.
Contact Us
"*" indicates required fields
18 King St. East Suite 303
Toronto, ON
M5C 1C4