Knowledge Centre
S&P-TSX vs S&P 500
September 2015
The past four years have not been kind to Canadian stocks when compared to U.S. stocks and adjusted for exchange rates. The average annual total return for the S&P/TSX Composite index for the four years ending December 31, 2014 was 5.5% versus 20.9% for the S&P 500 (all returns in C$ terms). This trend is continuing so far this year with Canadian stocks down 3.5% versus a 10.7% move to the upside for U.S. stocks (in C$) as at the end of August 2015. On the other hand the average annual returns from 1970 to 2010 are essentially identical across both markets at 11.3% and 11.4% respectively. So to say the last four years for Canadian equity investors has been disappointing is really an understatement.
Canadian and U.S. stock markets do not move together in lockstep, it only seems that way. The primary reason is that outside of banks and resources, there are few investment opportunities in Canada. The U.S. stock market in contrast is remarkably diverse and dominated by growth oriented sectors such as consumer discretionary, pharmaceuticals and technology. So when the bottom fell out of the resource sector and Canada's debt laden consumers came under pressure, investors in Canadian stocks began a period of prolonged disappointment.
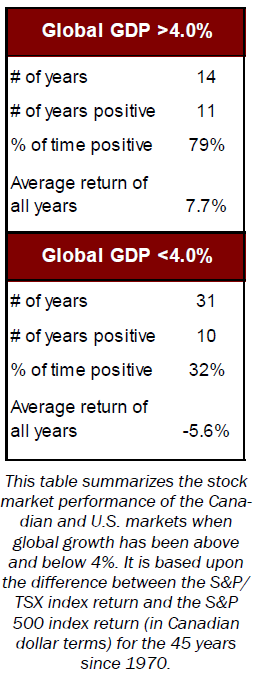
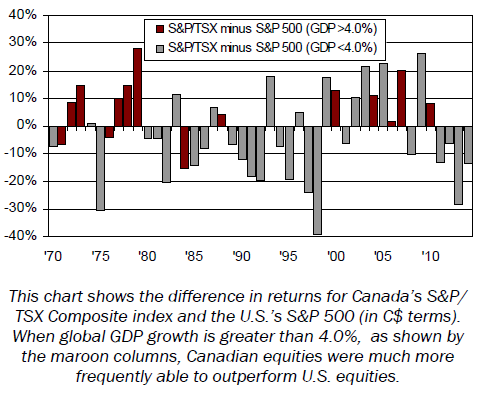
While there are a number of micro or country specific reasons at any given time that could lead to superior relative performance, there is one overriding factor: global economic growth. Specifically, the real annual Gross Domestic Product (GDP) for all the countries of the world. Over the past 45 years it has averaged 3.1% per year. However, for Canadian investors interested in outperforming the U.S. stock market, the magic number is 4.0% global GDP growth, which has occurred 14 times since 1970. When the world is growing its fastest, Canadian stocks generally do their best as Canadian stocks had superior relative performance to U.S. stocks 79% of the time. In fact, the average amount of outperformance for Canadian stocks versus the U.S. when the world's GDP exceeds 4.0% is 7.7% versus -5.6% underperformance the rest of the time. The chart to the right shows that when GDP growth is greater than 4.0% (the maroon columns) Canadian stocks were frequent outperformers. Clearly Canadian stock performance is on fire when the world is firing on all cylinders.
Canadian investors who remember the 1990s when the S&P/TSX plodded along producing an extended period of underperformance relative to the U.S. are feeling the same level of frustration now. Not surprisingly, the 2000s generally reversed this trend until the S&P 500 started playing catch up over the past four years of weaker economic growth.
The Organization for Economic Co-operation and Development (OECD), which represents 34 developed countries, has a downbeat opinion of the world's economy for 2015. This is due to various concerns such as business investment remaining below the level of previous recoveries, weak consumer demand, fickle fiscal policies and a lack of structural reforms. However next year the prospects are completely reversed with lower oil prices, monetary easing and currency depreciation finally kicking in to propel global GDP growth rate to an estimated 3.8%. This is very close to the level where Canadian stocks move to the forefront. And as history has shown, it is usually the downtrodden sectors or countries that rebound the most.
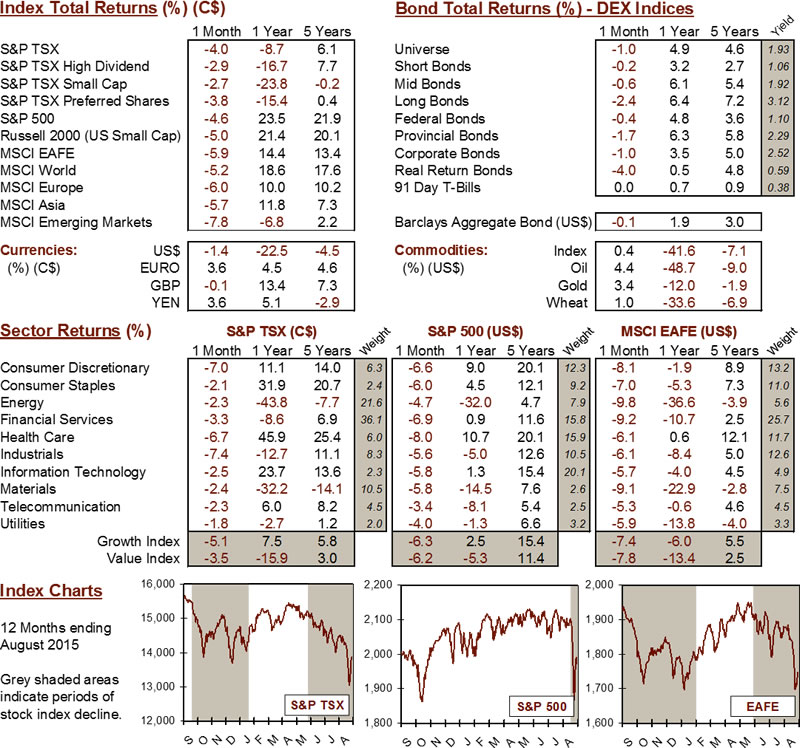
MARKET DATA
This report may contain forward looking statements. Forward looking statements are not guarantees of future performance as actual events and results could differ materially from those expressed or implied. The information in this publication does not constitute investment advice by Provisus Wealth Management Limited and is provided for informational purposes only and therefore is not an offer to buy or sell securities. Past performance may not be indicative of future results. While every effort has been made to ensure the correctness of the numbers and data presented, Provisus Wealth Management does not warrant the accuracy of the data in this publication. This publication is for informational purposes only.
Contact Us
"*" indicates required fields
18 King St. East Suite 303
Toronto, ON
M5C 1C4