Knowledge Centre
Misery Hates Company
November 2015
Across the investment landscape there are countless philosophies, gauges and indicators that have attempted to elicit exploitable intelligence and generate superior performance. The last century has seen new paradigms, recycled theories and just plain hokum put forward as the answer to every investor's dreams. In the end, solid fundamental and quantitative analysis tends to be the principal way to deliver value added results. Occasionally, however, a combination of old standby indicators can show surprisingly good insight.
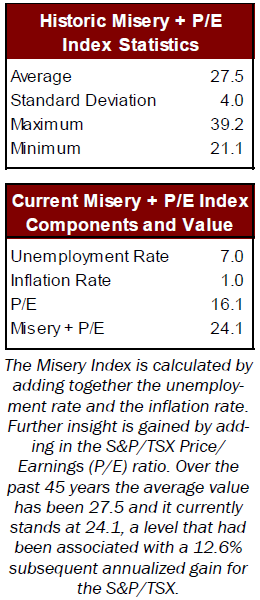
One of the best indicators that most investors have likely never heard of has delivered excellent long term success at predicting where the market is headed. The so called "Misery Index" is calculated by adding together the Canadian unemployment rate and the inflation rate. Further insight is gained by adding in the S&P/TSX Price/Earnings (P/E) ratio. The historic analysis of this combination has produced very interesting results.
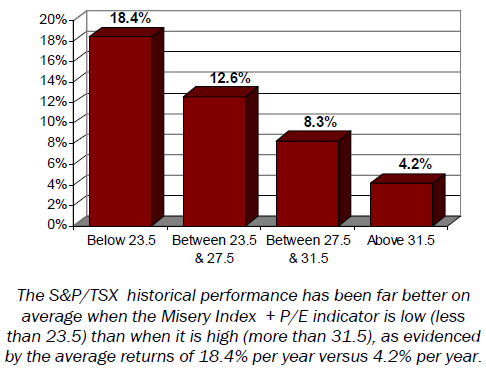
Looking back over the past 45 years (1970 to 2014) at the combined yearend figures for the three gauges shows a clear performance pattern for the Canadian stock market. The central value is 27.5 and the data was divided into four equally distributed subsets based on the standard deviation which works out to +/- 4.0. As the chart below and data on the left shows, the stock market's historical performance has been far better on average when this indicator is low (less than 23.5) than when it is high (more than 31.5), as evidenced by the average returns of 18.4% per year versus 4.2% per year. This pattern of strength or mediocrity has been very consistent.
Traditionally, the most commonly used valuation metric is the trailing P/ E ratio. The S&P/TSX P/E ratio is currently trading at 16.1 trailing earnings, which is a 6% premium to its long term average of 15.2 dating back to 1970. By this metric stocks could be said to be overvalued. However, real overvaluation does not typically occur until the market trades at one standard deviation above its long term average of 20.1, which is well above the current level.
But P/E ratios should be interpreted within the context of current macroeconomic conditions. For example, a low P/E is not automatically bullish as was seen in the late 1970s when inflation and unemployment were very high. Conversely, a high P/E is not automatically negative if it is accompanied by low inflation and unemployment. However, some P/E levels are so high that even low rates of inflation and unemployment cannot justify them.
That is especially relevant right now. When viewed in isolation, the current S&P/TSX P/E suggests a slightly overvalued market. But in the context of the current low level of the Misery Index, the market's current P/E does not appear to be out of line. In fact, the combined indicator currently stands at 24.1, which is below its historical average level. That puts the current market's valuation in the quadrant that is historically associated with a 12.6% annualized gain for the S&P/TSX.
So in theory Canadian stocks have a long way to appreciate before they can be considered expensive, based on this measure. Still, stock market valuations alone are not enough to propel investment decisions, as stocks constantly gyrate and overshoot perceived targets. Looking at any one valuation tool alone does not deliver the complete picture, as most investors well know.
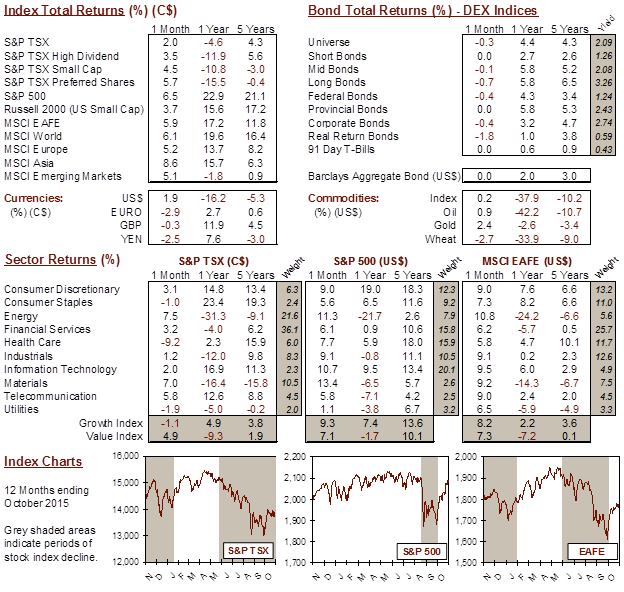
MARKET DATA
This report may contain forward looking statements. Forward looking statements are not guarantees of future performance as actual events and results could differ materially from those expressed or implied. The information in this publication does not constitute investment advice by Provisus Wealth Management Limited and is provided for informational purposes only and therefore is not an offer to buy or sell securities. Past performance may not be indicative of future results. While every effort has been made to ensure the correctness of the numbers and data presented, Provisus Wealth Management does not warrant the accuracy of the data in this publication. This publication is for informational purposes only.
Contact Us
"*" indicates required fields
18 King St. East Suite 303
Toronto, ON
M5C 1C4