Knowledge Centre
Who Will Lead?
October 2021
History never repeats itself in exactly the same way but similarities exist, especially in the timing of economic events or cycles. These recurring ups and downs in economic activity are called business or market cycles and are made up of several years of peaks, recessions, troughs and eventually a recovery phase. The peak, when business activity has reached its maximum levels, is followed by a slowdown or recession during which business activity reaches its lowest levels. The final phase, recovery, is when the economy again expands towards maximum output. Each phase can be short or quite long.
The movements of the financial markets are closely linked to the business cycle. Price trends in the three main markets, stocks, bonds, and commodities, are heavily influenced by investors’ expectations of the future. Each financial market tends to peak and bottom at different points in the business cycle. An expanding economy is generally favourable for the stock market, a weak economy for bond prices, and an inflationary economy for commodities, especially the price of gold.
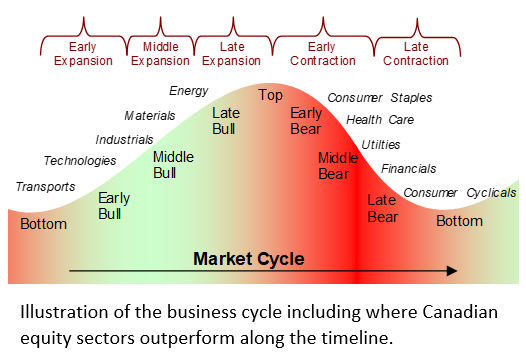
The overall stock market tends to lead the general economy with stock indices going up before the economy peaks and falling before a recession begins. However, the stock market is made up of companies from various economic sectors. These sectors, and their stocks, rotate in and out of favour during various phases of the business cycle. The chart to the right shows a typical business cycle and illustrates which sectors tend to outperform the broader market at particular intervals.
Economic recoveries are often led by consumer spending so the retail sector is a leader of the broader stock market and is usually one of the earliest sectors to peak and to bottom. The same holds for the banking, housing and construction industries which are heavily influenced by interest rates. As interest rates are cut, demand in these sectors grow, as does their stock price. These equity groups can bottom out as much as 12 months before the stock market. These sectors are perking up a little now, but there remain concerns that the de-leveraging process now in effect may hinder upside progress.
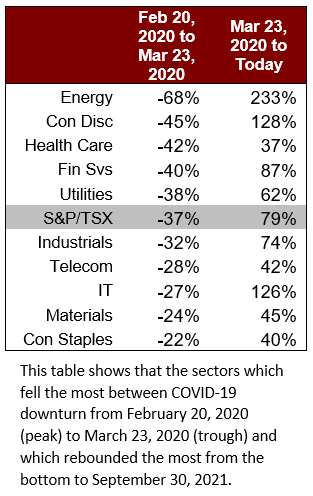
The table to the left shows sector performance during the onset of the COVID-19 pandemic. The first column has sector performance during the bear phase (February 20, 2020 to March 23, 2020) and the second is the recovery phase since the Canadian Equity market bottomed out. The inverse relationship is in most cases quite striking. Those sectors which performed the worst in the falling market increased the most when the market rebounded. Conversely those that had done well turned in a relatively flat performance when the market recovered. There is a pattern to these sector rotations. The industrial and manufacturing sectors usually follow the movement of retail and construction. As inventories become depleted, demand for manufacturing and industrial output increases. Because the economic environment and the news are often bad at this point, investors tend to be cautious and initially invest in companies with good earnings and cash reserves. As the bull market grows, investors tend to place money into relatively speculative stocks such as technology companies. In the later stages of expansion, when interest rates are rising, the capital goods, basic materials, and energy industries tend to thrive as they expand production capacity and bid for increasingly scarce resources. Precious metal stocks typically are strongest at this point as inflationary pressures increase.
Value stocks tend to outperform by falling less during bear markets and growth stocks tend to outperform in the bullish phase. Of course, there are many permutations and combinations that push and pull markets in all directions, but remember that being right all the time is next to impossible. The ebb and tide of the normal business cycle should not be frightening, particularly if you have professionally managed portfolios that invest in quality companies.
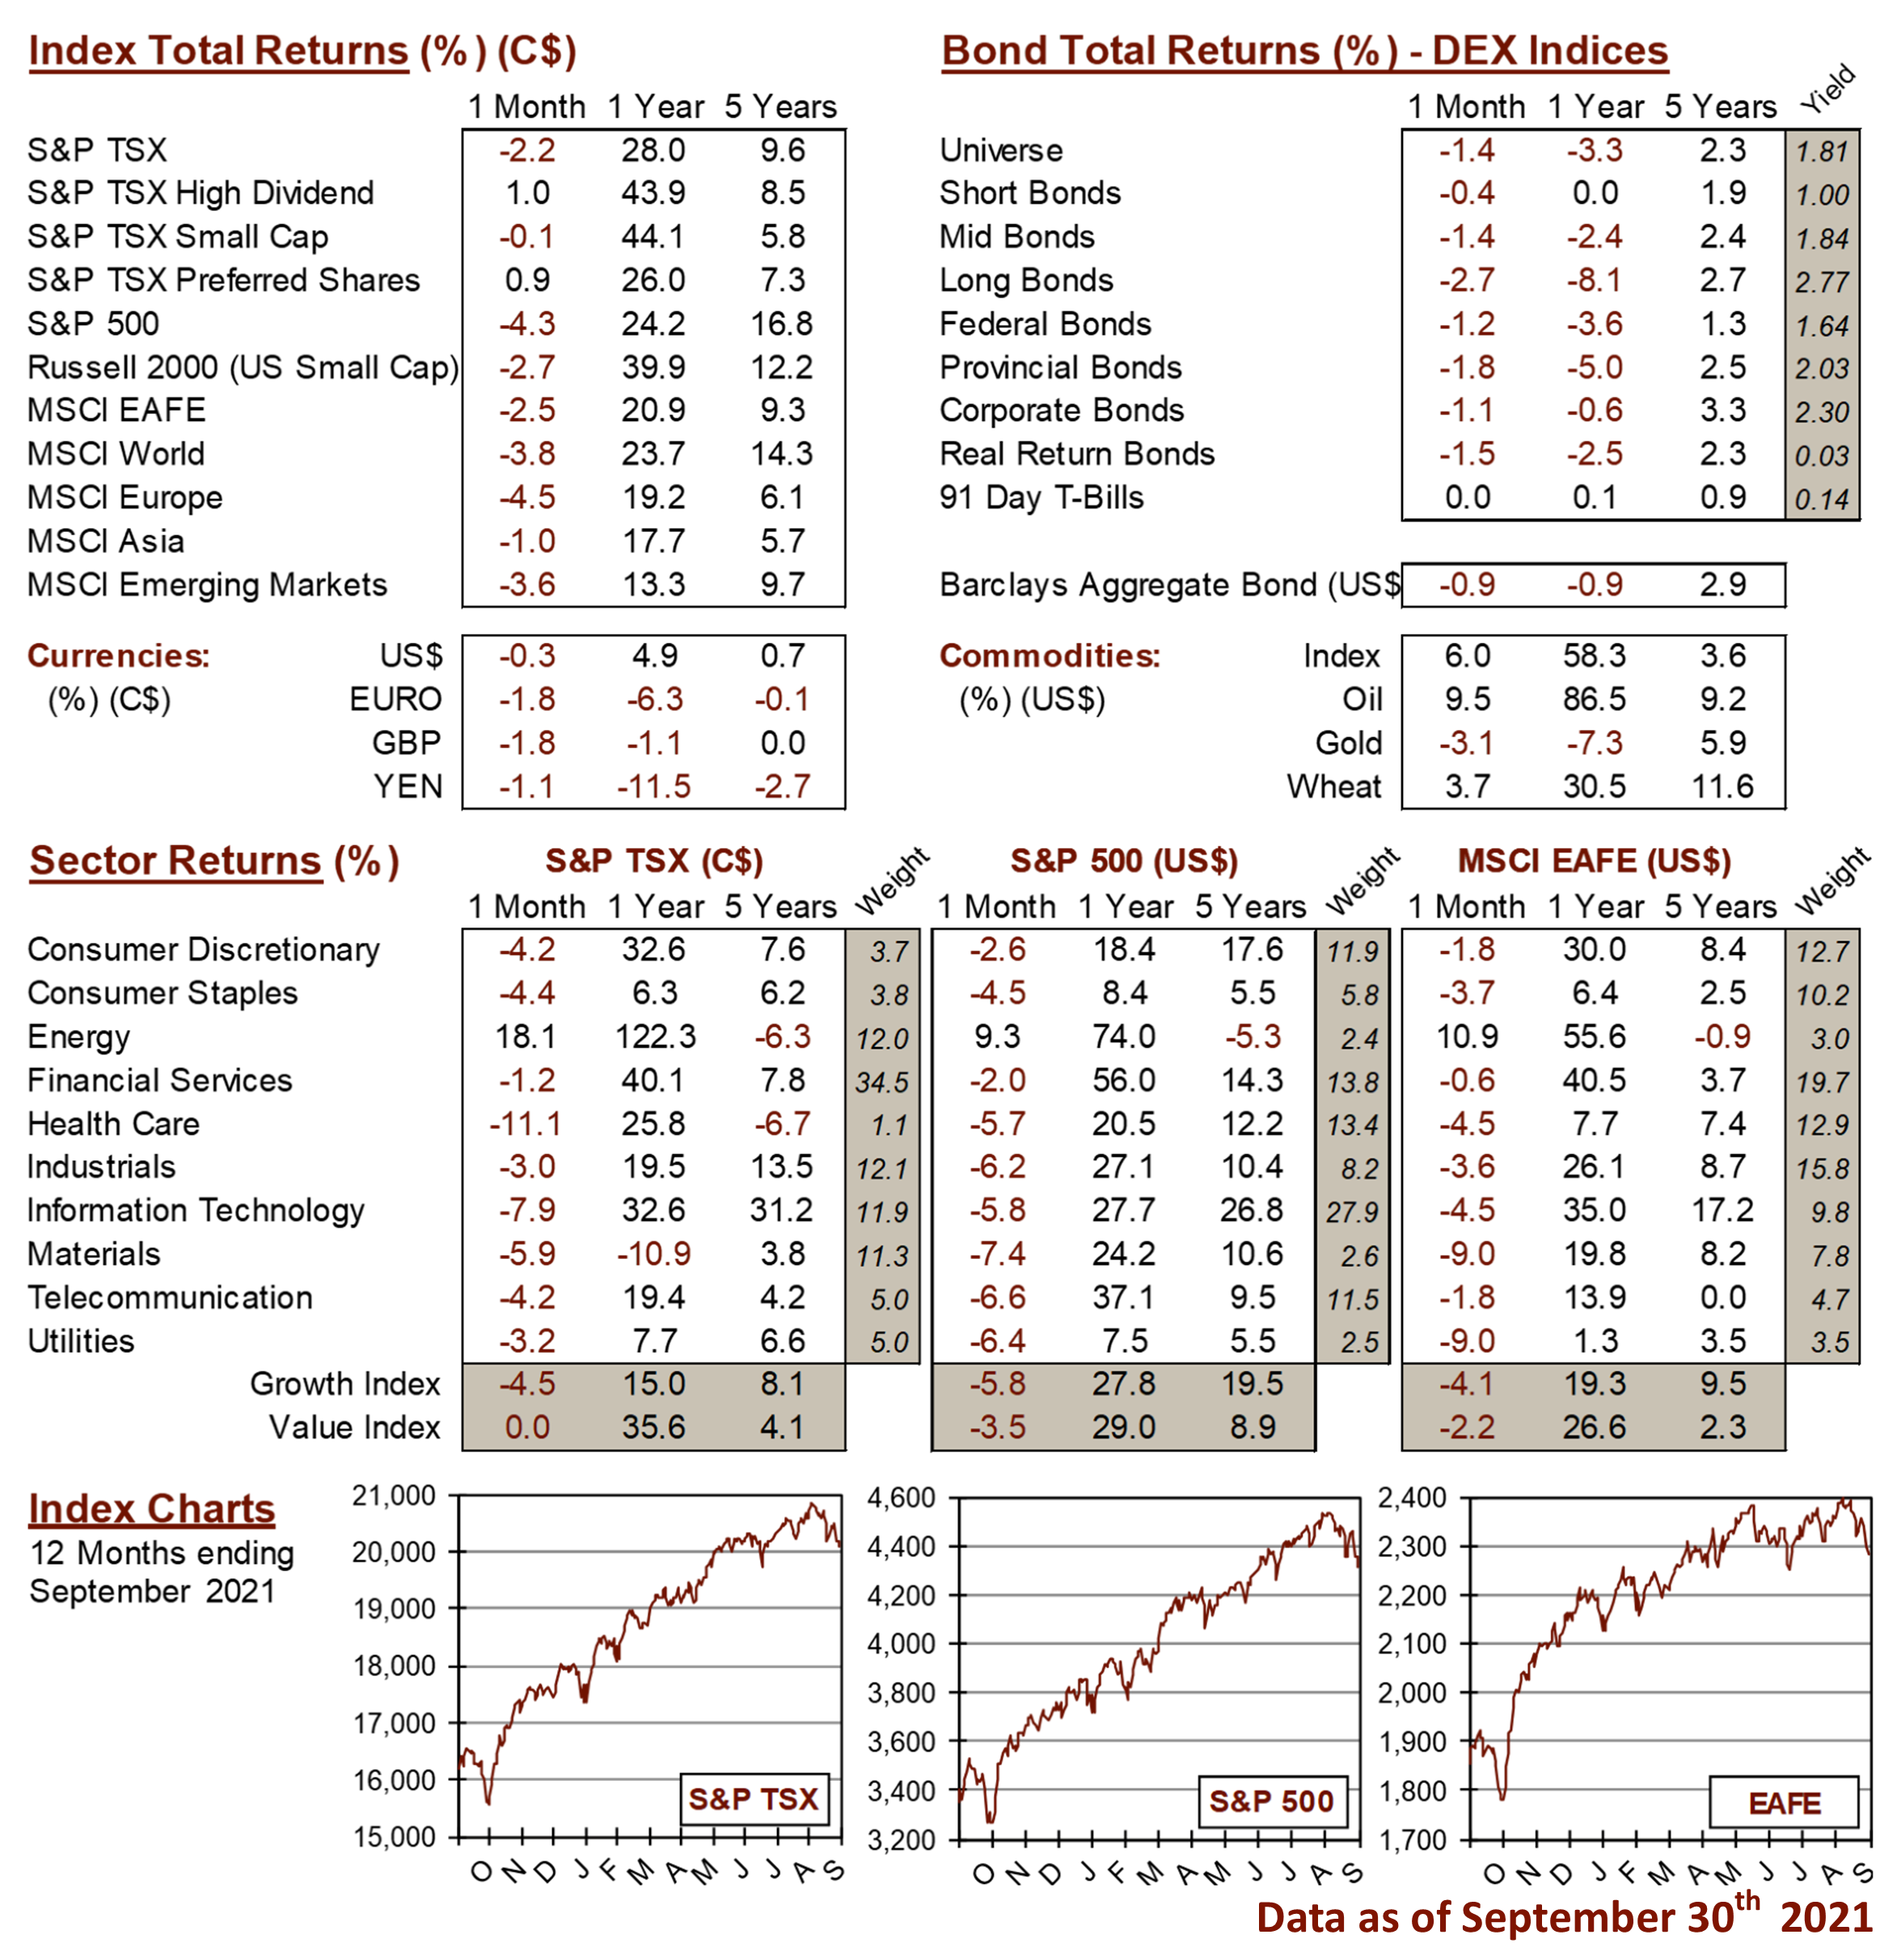
MARKET DATA
This report may contain forward looking statements. Forward looking statements are not guarantees of future performance as actual events and results could differ materially from those expressed or implied. The information in this publication does not constitute investment advice by Provisus Wealth Management Limited and is provided for informational purposes only and therefore is not an offer to buy or sell securities. Past performance may not be indicative of future results. While every effort has been made to ensure the correctness of the numbers and data presented, Provisus Wealth Management does not warrant the accuracy of the data in this publication. This publication is for informational purposes only.
Contact Us
18 King St. East Suite 303
Toronto, ON
M5C 1C4