Knowledge Centre
THE TRUE COST OF ETFS
April 2019
Most investors know that passive Exchange Traded Funds (ETFs) are low cost investment vehicles, correct? Well, almost right! Passive ETFs are “designed” to track an index or market at a low cost. ETFs may be relatively cheap from a Management Expense Ratio (MER) perspective but the costs don’t stop there. Putting aside the negative impact of brokerage costs and potential custodian or registration fees, ETFs in the majority of instances still underperform their underlying benchmark. So, the cost of owning any investment vehicles should be understood in terms of investment returns because underlying fees can also be a drag on performance.
While ETFs ownership is growing, Mutual and Segregated funds are still the primary investment vehicle for retail investors. There have been countless studies concerning the weak returns of funds in Canada relative to their benchmarks, however a new approach has been developed by S&P Dow Jones Indices. The SPIVA Canada Scorecard quantifies the mutual fund industry’s peccadilloes. In its own words, it “reports on the performance of actively managed Canadian mutual funds versus that of their benchmarks. The SPIVA Scorecards are the de facto scorekeepers...” The latest result based upon five years of data confirms that equity mutual funds have underperformed their benchmark, often because of fees.
Investors should determine if they are getting what they are paying for by tracking the difference between an ETF’s performance and the benchmark’s performance. The resulting Tracking Difference is seldom zero. This is easy to find as ETFs are required to file a Management Report of Fund Performance (MRFP) twice a year on the SEDAR.ca website. Other factors could impair returns such as the trading and rebalancing costs which occur when ETFs realign themselves as indices adjust their holdings, sampling issues that occur when it is impractical to hold every security in the index, and there is a cash drag between when the ETF receives dividend and interest payments and when it then distributes them to shareholders. A recent 2019 study by ETF.com has indicated that the average Bid/Ask spread across more than 2,200 U.S. ETFs was 0.48%. This spread is another significant cost to trading ETFs and detracts from performance whenever trading occurs. U.S. fixed income ETFs tend to have the lowest spreads of 0.17%; while all other ETF average spreads range from 0.24% to 0.56%.
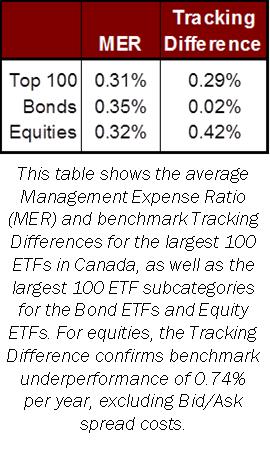
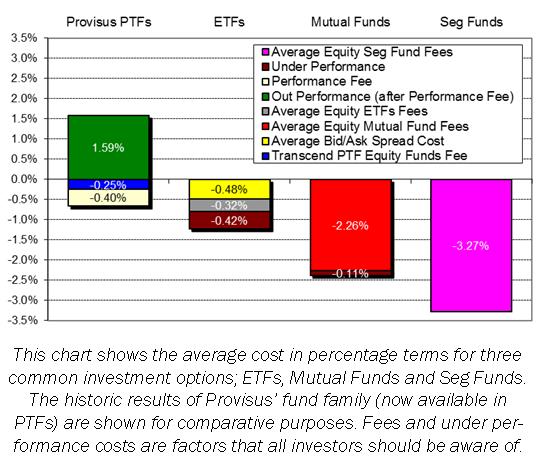
Additional costs detract from performance as the chart to the right shows the percentage cost of these investment vehicles. The table to the left shows the pro-rata weighting MER and Tracking Difference for the Top 100 ETFs and their major asset subcategories. In Canada there are more than 830 ETFs as of March 31, 2019 but the largest 100 represent over 70% of all the invested assets. Interestingly, the average MER across the entire Top 100 ETFs is 0.31% (individual MERs ranged from 0.05% to 1.29%). These numbers have remained very consistent over the past three years. By gathering both the MER and Tracking Difference we are able to see all these costs.
For most investors the objective is to earn value added performance. However, fees and other costs can sap returns. The aim of a Passive ETF is to mirror its benchmark so they are not designed to outperform. Without an understanding of Tracking Difference and other costs, investors could be virtually guaranteeing themselves underperformance.
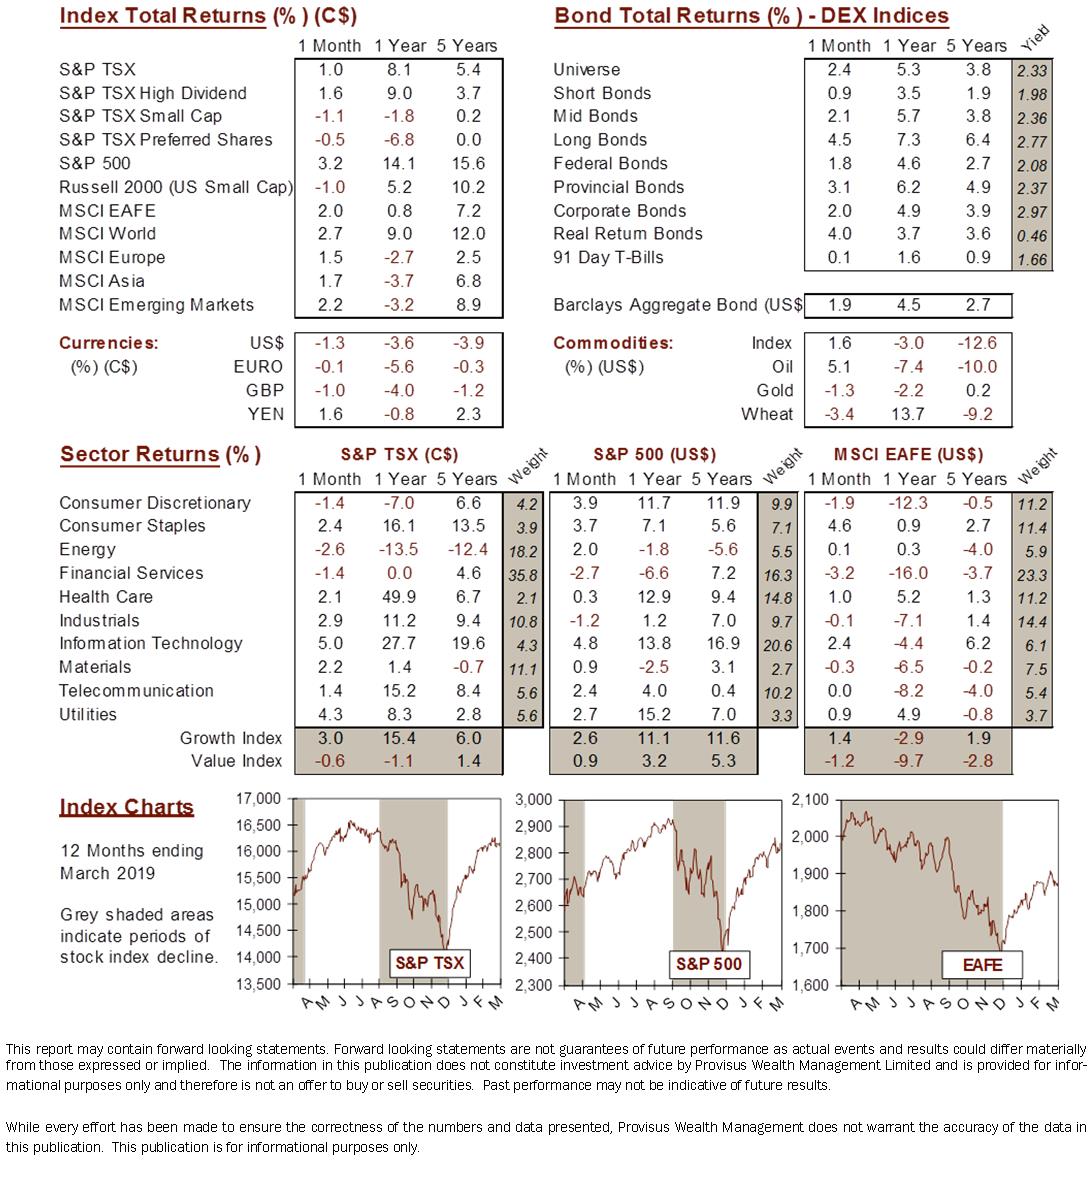
MARKET DATA
This report may contain forward looking statements. Forward looking statements are not guarantees of future performance as actual events and results could differ materially from those expressed or implied. The information in this publication does not constitute investment advice by Provisus Wealth Management Limited and is provided for informational purposes only and therefore is not an offer to buy or sell securities. Past performance may not be indicative of future results. While every effort has been made to ensure the correctness of the numbers and data presented, Provisus Wealth Management does not warrant the accuracy of the data in this publication. This publication is for informational purposes only.
Contact Us
18 King St. East Suite 303
Toronto, ON
M5C 1C4