Knowledge Centre
The Real Cost of ETFs – Not just the MER
June 2016
Most investors know that passive Exchange Traded Funds (ETFs) are low cost investment vehicles, correct? Well, almost right! Passive ETFs are designed to track a benchmark index or market at a low cost. ETFs may be relatively cheap from a Management Expense Ratio (MER) perspective but the costs don’t stop there. Putting aside the negative impact of brokerage costs to buy and sell and potential custodian or registration fees, ETFs in the majority of instances still underperform their underlying benchmark.
In a perfect world ETFs would precisely return the same performance of their benchmarks but this is not realistic. Therefore investors should determine if they are getting what they are paying for by tracking the difference between an ETF’s performance and the benchmark’s performance. The resulting Tracking Difference is seldom zero and usually trails its benchmark. It is easy to find as ETFs are required to file a Management Report of Fund Performance (MRFP) twice a year on the SEDAR.ca website.
Of course fees are almost always the cause of performance lags and are the single best indicator of future Tracking Difference. That is why ETF issuers keep trying to offer the lowest fees. However other factors could impair returns such as the trading and rebalancing costs which occur when ETFs realign themselves as indices adjust their holdings, sampling issues that occur when it is impractical to hold every security in the index and there is a cash drag between when the ETF receives dividend and interest payments and when it then distributes them to shareholders.
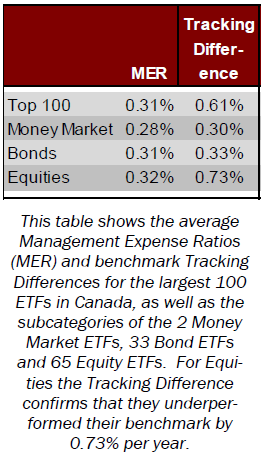
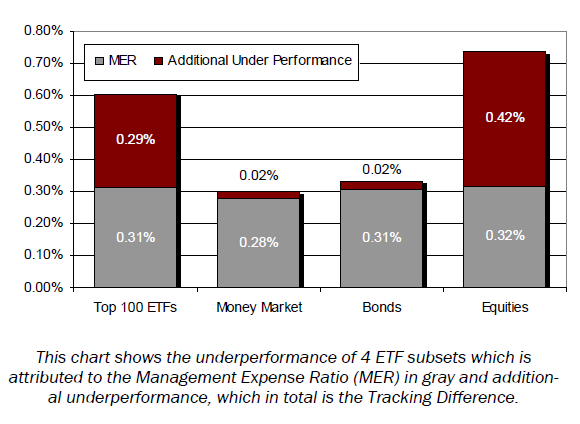
In Canada there are more than 425 ETFs but the largest 100 by assets represent over 83% of all the invested assets. These Top 100 ETFs as of May 31, 2016 provide an excellent sample of the extent of any lag in performance relative to the benchmark. By gathering both the MER and the Tracking Difference (based upon 3 years of information ending December 2015) we are able to see how much of the underperformance is attributed to these costs. The chart above and the table on the left show this analysis on a pro-rata weighting basis for the Top 100 ETFs and their major asset subcategories. Interestingly, the average MER across the entire 100 ETFs is 0.31% (individual MERs ranged from 0.03% to 0.91%) and this remains very consistent across all the asset classes despite the fact that the number of individual ETFs per category varies dramatically with 2 Money Market ETFs, 33 Bond ETFs and 65 Equity ETFs. The other surprising item about this data is that while Money Market and Bonds had very little additional underperformance that was not directly attributed to fees, this was not the case for Equities. Equities, on average, significantly underperformed their benchmark by 0.73% per year, which flowed through to the entire sample underperformance (0.61%) since equities are such a large part of the Top 100 ETF group. This cost/weakness is much more than most investors know about or expect.
The aim of a Passive ETF is to mirror its benchmark so they are not designed to outperform. As such, Tracking Difference is one of the most important ETF statistics to consider. Without an understanding of Tracking Difference, investors could be virtually guaranteeing themselves underperformance.
MARKET DATA
This report may contain forward looking statements. Forward looking statements are not guarantees of future performance as actual events and results could differ materially from those expressed or implied. The information in this publication does not constitute investment advice by Provisus Wealth Management Limited and is provided for informational purposes only and therefore is not an offer to buy or sell securities. Past performance may not be indicative of future results. While every effort has been made to ensure the correctness of the numbers and data presented, Provisus Wealth Management does not warrant the accuracy of the data in this publication. This publication is for informational purposes only.
Contact Us
18 King St. East Suite 303
Toronto, ON
M5C 1C4