Knowledge Centre
SURGING OIL PRICE = GOOD EQUITY MARKETS
October 2019
Contrary to popular belief, on a global scale there is very little correlation between the stock market and oil prices. Generally stock prices rise and fall based on future corporate earnings reports, intrinsic values, investor risk tolerances and many other factors. In other words, markets are too complex to expect one commodity to drive business activity in a predictable way. Of course, with energy stocks currently representing only 5.1% of global stock market capitalization this makes sense. However, in Canada, energy stocks represent 16.5% of the overall stock market (down from 27% five years ago when oil prices peaked). So domestically the situation is vastly different.
Contrary to popular belief, on a global scale there is little correlation between the stock market and oil prices. Generally stock prices rise and fall based on future corporate earnings reports, intrinsic values, investor risk tolerances and many other factors. In other words, markets are too complex to expect one commodity to drive business activity in a predictable way. With energy stocks currently representing only 5.1% of global stock market capitalization this makes sense, however in Canada energy stocks represent 16.5% of the market (down from 27% when oil prices peaked 5 years ago) so our domestic situation is vastly different.
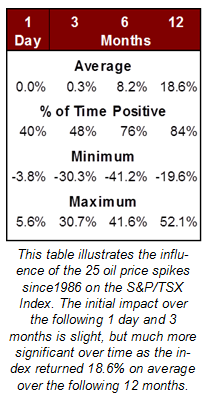
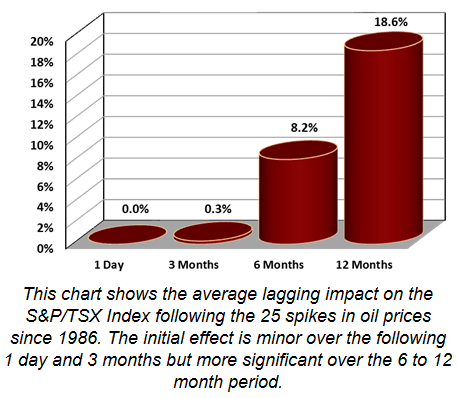
In Canada, stocks tend to rise in the months after a big oil price jump. Not immediately, but over time the end result is very consistent. The way the stock market reacts following a 10% or more increase in the price of crude oil is very informative. As the chart below illustrates, the initial same-day impact is negligible, however, over time a very persistent pattern emerges. The S&P/TSX Canadian Stock Index (excluding the impact of dividends) on average returns only 0.3% after 3 months, then climbs 8.2% on average after 6 months following the 25 spikes in oil prices since 1985. On average the returns are 18.6% in the 12 months after a jump in oil prices.
The attack in Saudi Arabia on September 16, 2019 triggered a one day spike in oil prices of 14.7%. Prior to this event the last spike was 12.3% on February 12, 2016. As the data to the left shows, past episodes (albeit with some notable exceptions) haven’t caused much harm to stocks. There are always exceptions to every rule with some periods of significant losses in stocks after oil prices spike (as seen by the minimum stock market returns). However, over longer time periods, downturns in stock prices are the exception. On average over the 12 month periods after oil spikes, we see positive stock performance 84% of the time. As an investor those are odds you should take every time, especially if the average return is 18.6%.
Despite these bullish average outcomes, there is still reason for investor concern. When there have been numerous instances of spikes in oil prices, the stock market was hit with significant volatility. Following a September 22, 2008 rise in oil prices of 15.7%, the S&P/TSX Canadian Stock Index returned -41.2% after 6 months and -19.6% after 12 months (this was the worst period over the past 34 years), as the economy descended into a deep recession. Another example is June 20, 1990, when the price of crude oil rose 11.1% in the months leading up to the Iraqi invasion of Kuwait. As that conflict expanded over the next year, there were more than 25 instances where crude oil prices rose more than 5% during a single trading day. Six months after the initial price spike, the S&P/TSX Canadian Stock Index was 9.4% lower.
Soaring crude oil prices can sow uncertainty in global financial markets. However, much of the strength of equity markets following big changes in oil prices can be directly attributed to the energy sector itself. Given the still relatively large weighting of the energy sector in Canada there is no reason to expect this outperformance to change. As for the Canadian stock market, any reason for increased optimism is very welcomed.
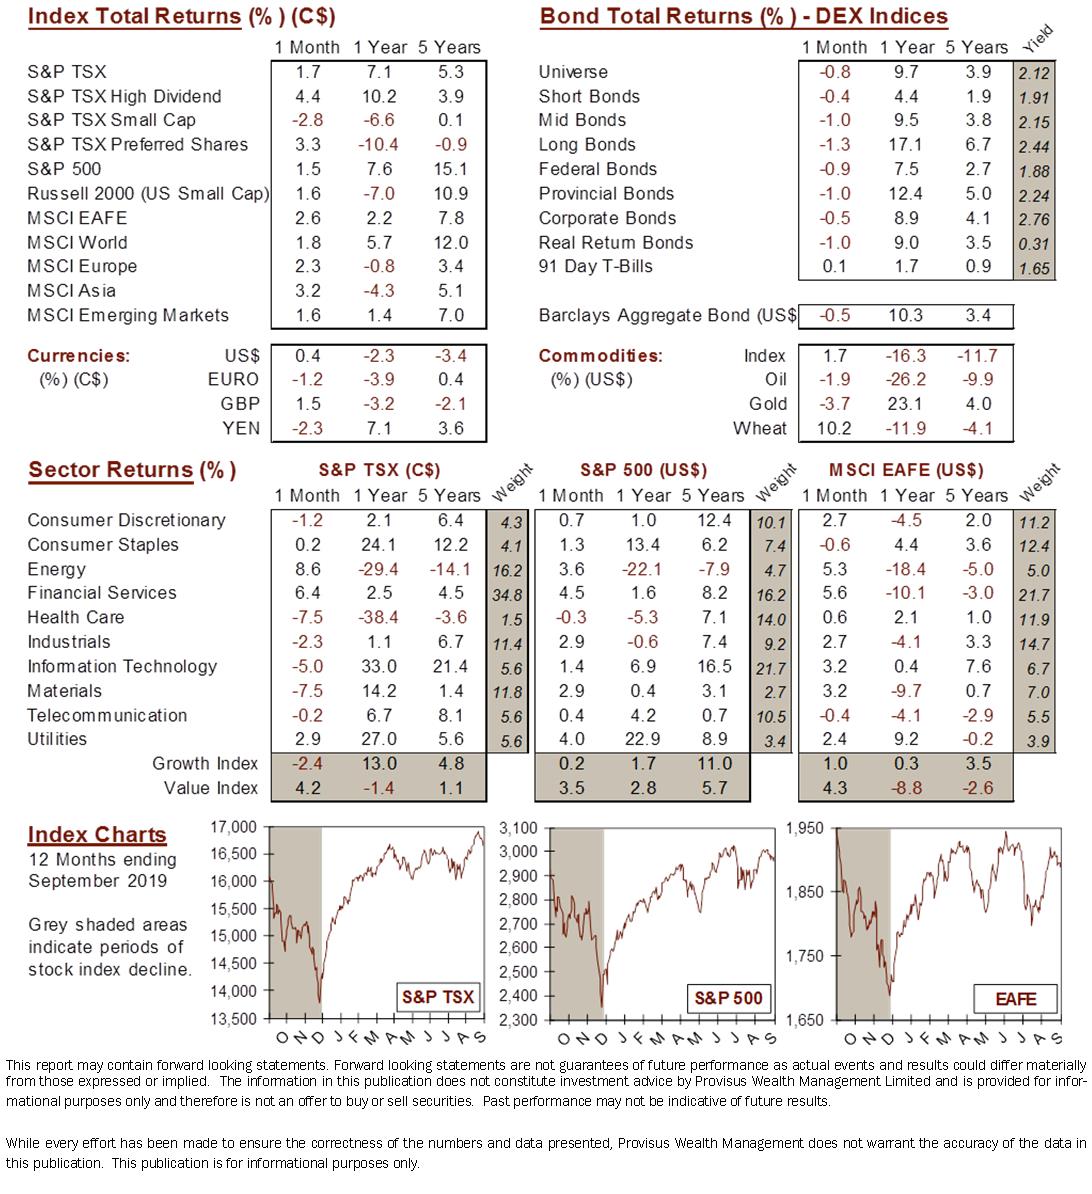
MARKET DATA
This report may contain forward looking statements. Forward looking statements are not guarantees of future performance as actual events and results could differ materially from those expressed or implied. The information in this publication does not constitute investment advice by Provisus Wealth Management Limited and is provided for informational purposes only and therefore is not an offer to buy or sell securities. Past performance may not be indicative of future results. While every effort has been made to ensure the correctness of the numbers and data presented, Provisus Wealth Management does not warrant the accuracy of the data in this publication. This publication is for informational purposes only.
Contact Us
18 King St. East Suite 303
Toronto, ON
M5C 1C4