Knowledge Centre
Stocks Rally After Rate Hikes
August 2017
The Bank of Canada (BOC) has just implemented its first interest rate hike since 2010 which means a lot of investors are grabbing their crystal balls trying to forecast the future course of the stock market. Historically there has been a strong inverse relationship between interest rates and stock prices. Specifically, when interest rates rise stock prices eventually fall. But equity bull markets do not end after the first rate hike. The data confirms that stock markets have continued to appreciate for extended periods after an initial central bank interest rate hike.
When central banks raise rates there is a reduction in the amount of money in circulation which makes borrowing more expensive. The initial result of a higher bank rate is that commercial banks increase their rates for borrowing money. Individuals are affected through mounting credit card and mortgage rates which decreases the amount of money they have to spend. Businesses are affected as they also borrow money to run and expand their operations so they have less to spend which results in less profitability. This of course makes the stock market a less attractive place for investors which will eventually lead to reduced stock prices.
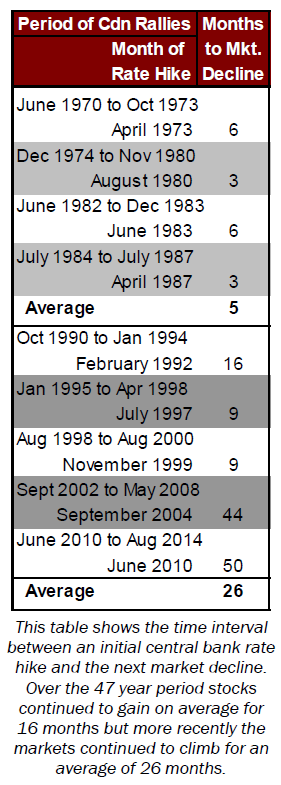
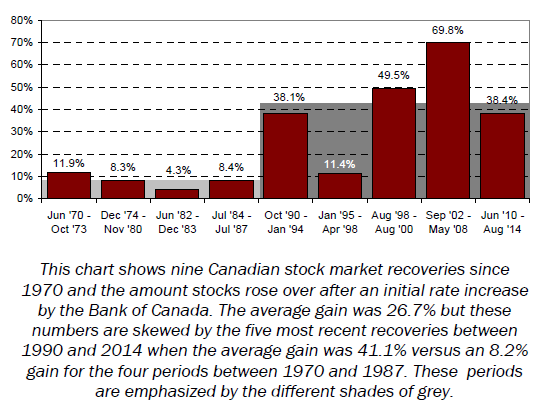
The BOC has kept its benchmark overnight interest rate at 0.5% since it started cutting rates in January 2015 but had been expected to reverse its effort to hold down yields. Investors had become antsy about the timing of the rate hike and the implications for the market even though a BOC rate increase does not have a direct impact on stock prices. No one can accurately predict a market top or correction. There are many reasons for stocks to drop in a rising interest rate environment and many of these factors are interrelated. As the chart below and data to the left shows, markets continued to appreciate after an initial interest rate hike. Looking at nine Canadian stock market recoveries since 1970 (with the exception of the recovery from May 1988 to August 1989 which was omitted since the period did not have an interest rate hike) there are two distinct periods, from 1970 to 1989 and from 1990 to 2014, as reflected by two factors; the time interval between the initial rate hike and the next stock market decline, and the amount stocks rose over that interval.
Over the entire 47 year history, stocks continued to gain on average for 16 months after the initial rate hike and gained 26.7%. However these numbers are highly skewed by the 1990 - 2014 period where the average time interval from rate hike to market decline was 26 months and the average gain was 41.4%, compared to 5 months and an 8.2% gain in the 1970 - 1987 period. It is not clear why there is such a pronounced difference but the first interval was subject to high inflation which could be a factor. These distinct periods are emphasized by two different shades of grey in the chart and table.
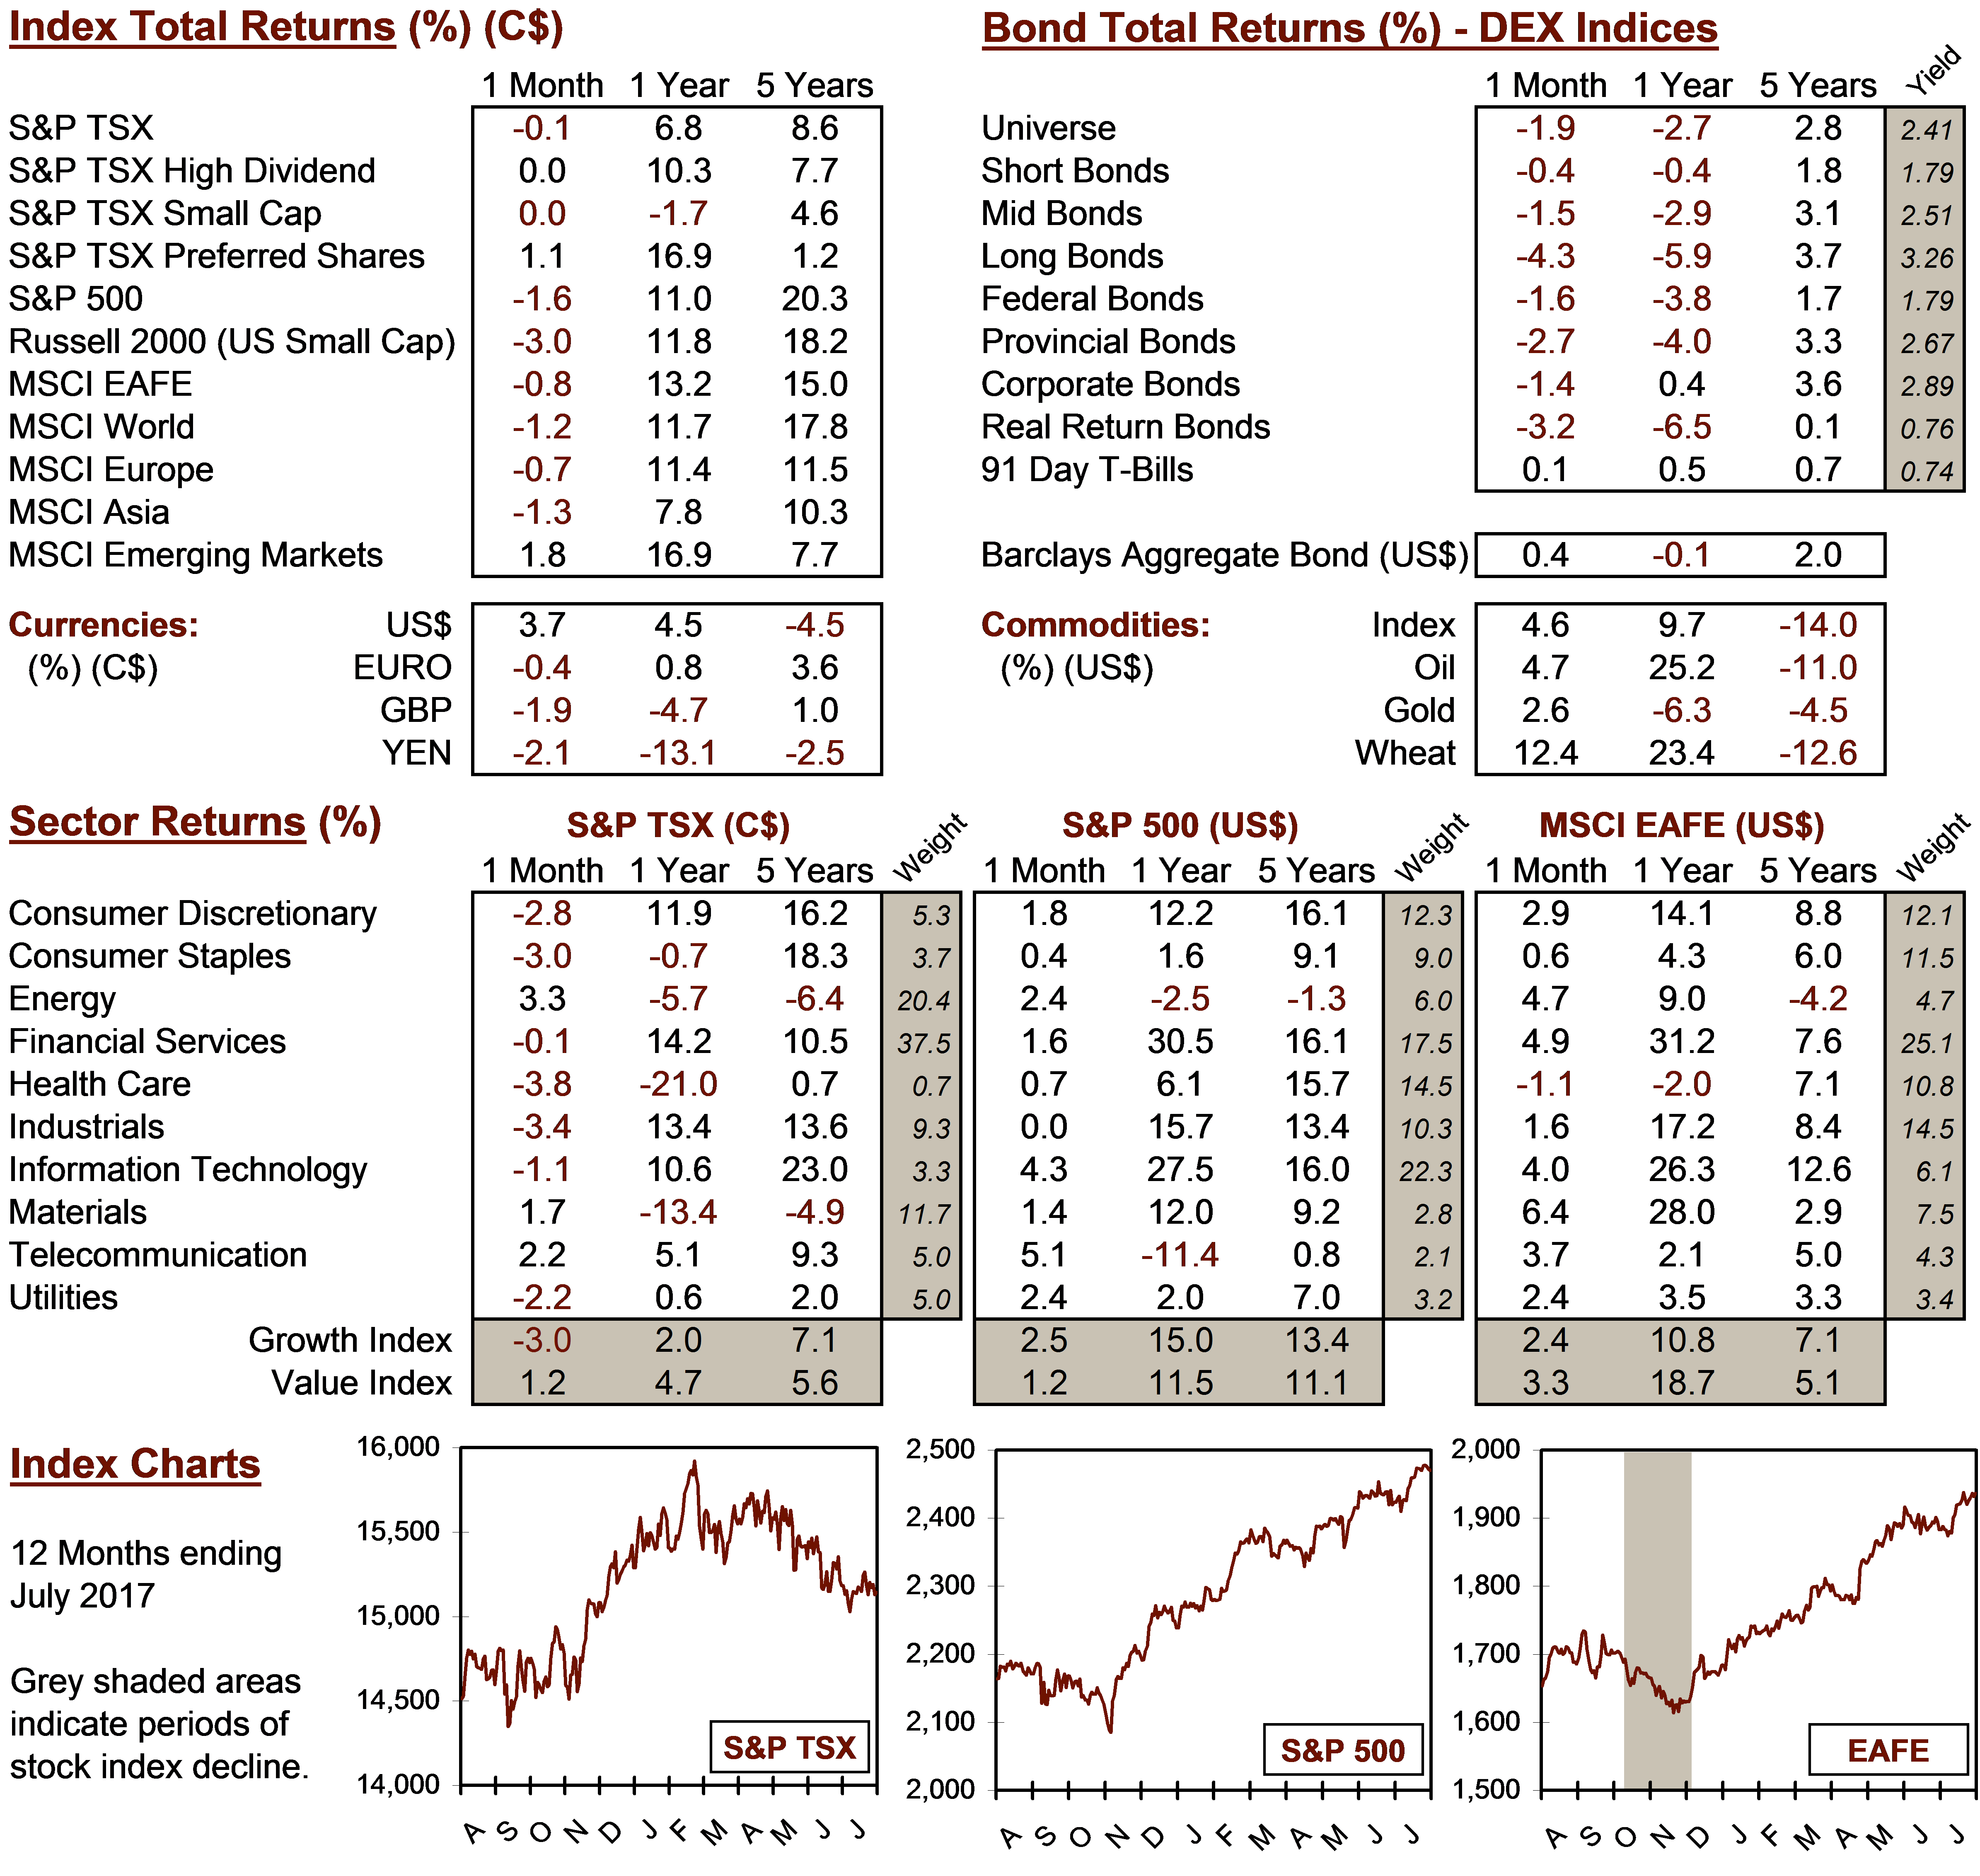
Interestingly, the Materials sector outperformed all other sectors of the market over the first three months of the last five periods of interest rate hikes, with an average return of 9.7% versus Financials which gained 1.8%, Energy which gained 0.6% and the benchmark which added 2.4%. While a rising interest rate environment may not be detrimental to equity market returns initially, there is no disputing the ultimate outcome. Despite this there are many defensive stocks and measures that can be taken to mitigate a downturn. Though, clearly investors should be hoping that the nearer term history is more likely to repeat itself.
MARKET DATA
This report may contain forward looking statements. Forward looking statements are not guarantees of future performance as actual events and results could differ materially from those expressed or implied. The information in this publication does not constitute investment advice by Provisus Wealth Management Limited and is provided for informational purposes only and therefore is not an offer to buy or sell securities. Past performance may not be indicative of future results. While every effort has been made to ensure the correctness of the numbers and data presented, Provisus Wealth Management does not warrant the accuracy of the data in this publication. This publication is for informational purposes only.
Contact Us
18 King St. East Suite 303
Toronto, ON
M5C 1C4