Knowledge Centre
Stocks Continue Historic Trend
November 2016
The Canadian stock market rally has been going on (in reality off and on) since March 2009. Stock prices have increased by more than 125% and it appears that some momentum remains. Should we be celebrating? There is certainly a strong bullish case to be made because in 74% of all market declines going back to 1924 stocks gained ground in the second year after a bear market decline. This pattern of longer term market performance offers some reassurance, however we cannot blindly assume that the market will continue to perform as it has recently. Often a stock that builds momentum in one year carries it over into the next. Stocks began surging in 2009 and investors would love to see that trend continue.
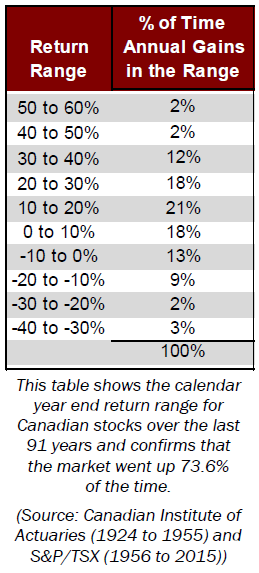
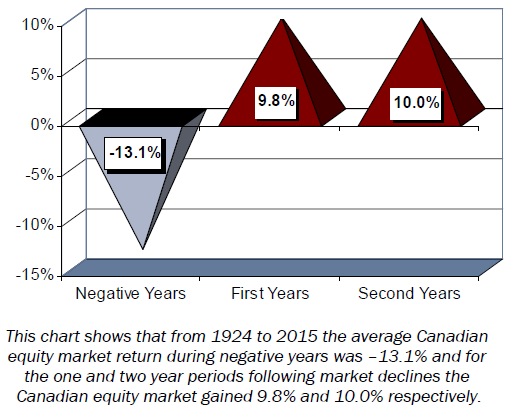
Consider the calendar year end returns for Canadian stocks using data from the S&P/TSX (1956 to 2015) and Canadian Institute of Actuaries (1924 to 1955). We find that the market rose in 67 of those 91 years, or 74% of the time. Unfortunately, this means that there were 24 calendar years of negative returns. Just as importantly, in 74% of cases stocks also experienced a rally in the year following the increase. As the chart below shows, the average decline during these 24 declining years was -13.1% and the average return in the year following the declines was 9.8%. Perhaps even more interesting is that in the second year after an annual decline, the market generated an impressive 10.0% average return.
If history is a guide, the second verse will echo the first. The market's performance so far has mirrored a pattern common to every bull market since 1949. In a rally's first year, small cap shares typically beat large cap rivals, though a rising tide lifts all boats. In addition, low quality issues generally outdo high quality as investors get more comfortable with risk. The worst become first and economically cyclical sectors outperform defensive ones. During the second year, historically, stocks kept rising. Small cap stocks continue to outperform large caps and higher quality issues with stable and growing earnings trump low quality names. The second year is important because it provides a clue as to the industries that are likely to perform for several years as long as the economy continues to grow.
What really seems to drive the second year after a winning year is mutual fund investors who had continued to remain wary. Ask most financial professionals and they will tell you the same thing: mutual fund investors flee the stock market and then jump back in, but often too late. The evidence of the past year seems to support that view, as new money coming into stock mutual funds has been negligible even as returns have been strong. An influx into stocks in the coming months would suggest mutual fund investors are once again waiting too long.
Stocks have taken a circuitous route to scale the wall of worry and have gained 16.5% in 2016 year-to-date, after the 8.3% decline in 2015. There has been a lot of uncertainty this year regarding the amount of gains and losses, so investors have remained skittish. Still, the rush into equities where prospects are the least tied to the economic cycle (energy and material stocks) has been particularly evident. The fact that investors have been left with few options for meaningful returns has fuelled the rebound in stocks since the February 2016 low. The question remains, will investors continue to return this year and next in greater numbers, repeating the pattern of previous bull markets and push the stock market up for a second straight year after a down year? History may not repeat itself, but it could rhyme and that will definitely be great news for diligent investors.
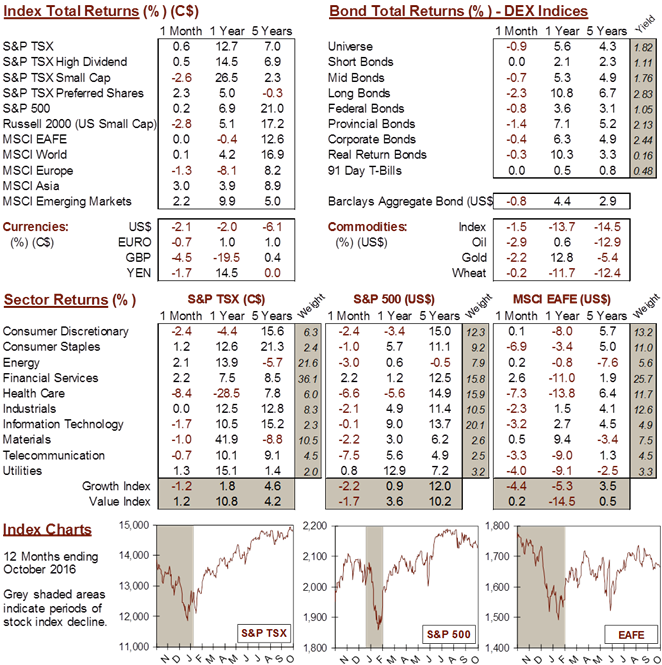
MARKET DATA
This report may contain forward looking statements. Forward looking statements are not guarantees of future performance as actual events and results could differ materially from those expressed or implied. The information in this publication does not constitute investment advice by Provisus Wealth Management Limited and is provided for informational purposes only and therefore is not an offer to buy or sell securities. Past performance may not be indicative of future results. While every effort has been made to ensure the correctness of the numbers and data presented, Provisus Wealth Management does not warrant the accuracy of the data in this publication. This publication is for informational purposes only.
Contact Us
18 King St. East Suite 303
Toronto, ON
M5C 1C4