Knowledge Centre
Snapping the Losing Streak
January 2017
Many people say there are no certainties in life; except for death, taxes, and the Toronto Maple Leafs not winning the Stanley Cup. When it comes to portfolio management, investment decisions are not made based on certainties but rather probabilities. We cannot make decisions based on what will happen since it is impossible to know the future. We make decisions based on analyzing all known information, considering scenarios, and assigning the likelihood of events. While we cannot say for certain that the Canadian market will outperform the U.S. next year there are several indicators which suggest it may.
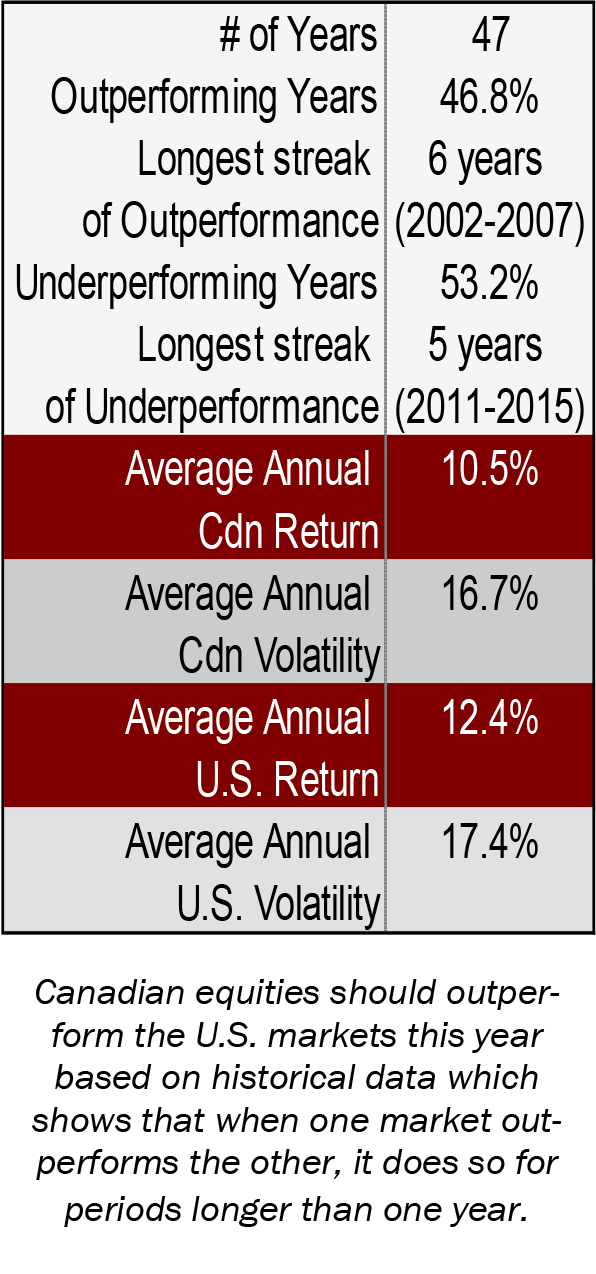
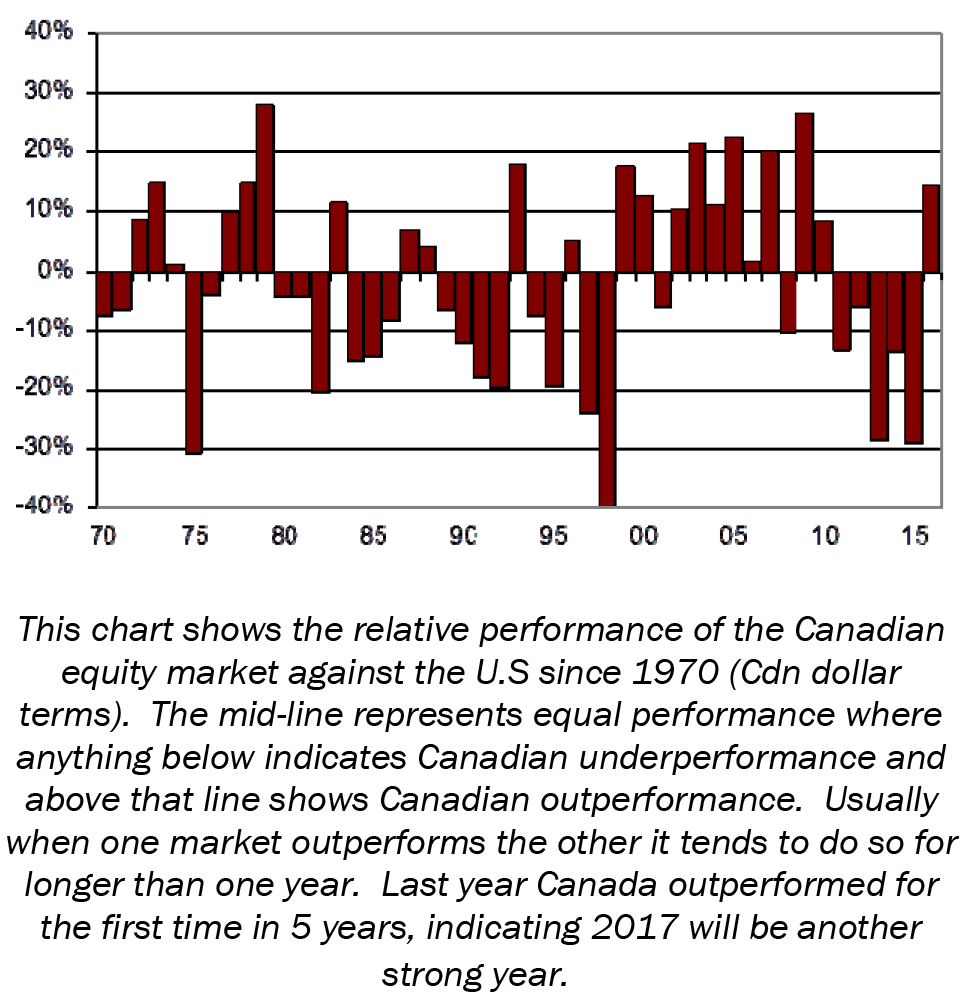
As illustrated by the graph below and data on the left, the relative outperformance history of Canadi- an vs U.S. stock markets is surprisingly close to even. Since 1970, the Canadian market has outper- formed the U.S. nearly 47% of the time; basically a coin flip. What’s interesting about the relative outperformance, much like when you repeatedly flip a coin, is that the pattern doesn’t go heads, tails, heads, tails...., but rather it tends to have streaks or clusters together.
When a market has relative outperformance it tends to form a trend lasting for more than one year. In 2016, after five years of underperformance, Canadian stocks broke their relative losing streak. Based on historical probabilities this could signal the beginning of a new winning streak, since single year outperformance is an anomaly - occurring only 13% of the time (6 years out of 47 years).
While the Canadian stock market is only 1.8% below its all time high and the U.S. equity markets have hit new highs on optimism for Donald Trump’s pro-growth policies investors shouldn’t ignore how Canada could also benefit. Over half of the S&P / TSX Composite index revenues are tied to activities outside of Canada and most of that is in the U.S. A stronger U.S. economy will also boost demand for resources whether that is in the Mining, Materials, or Energy sectors.
Also consider that the TSX is loaded with stocks that benefit from a rising interest rate environment, particularly the banks and insurance companies which make up about 30% of the index.
Lastly, the TSX has been a strong performer in years when oil prices rise. This appears to be happening based on the recent initiatives of the oil producing states. It is reasonable to expect oil prices to rise as a result of slowing global supply growth, as well as increasing demand getting a further boost from the growth of the U.S. economy.
While there is the possibility that Trump’s policies will fail or never get enacted, disappointments in the U.S. could drive more money into Canada, and the record levels for U.S. stock markets may make the move even more pronounced.
Given the current climate of recovering oil and commodity prices, and rising interest rates, earnings for the S&P / TSX have the potential to outperform in 2017. If only we could say the same about the Leafs...
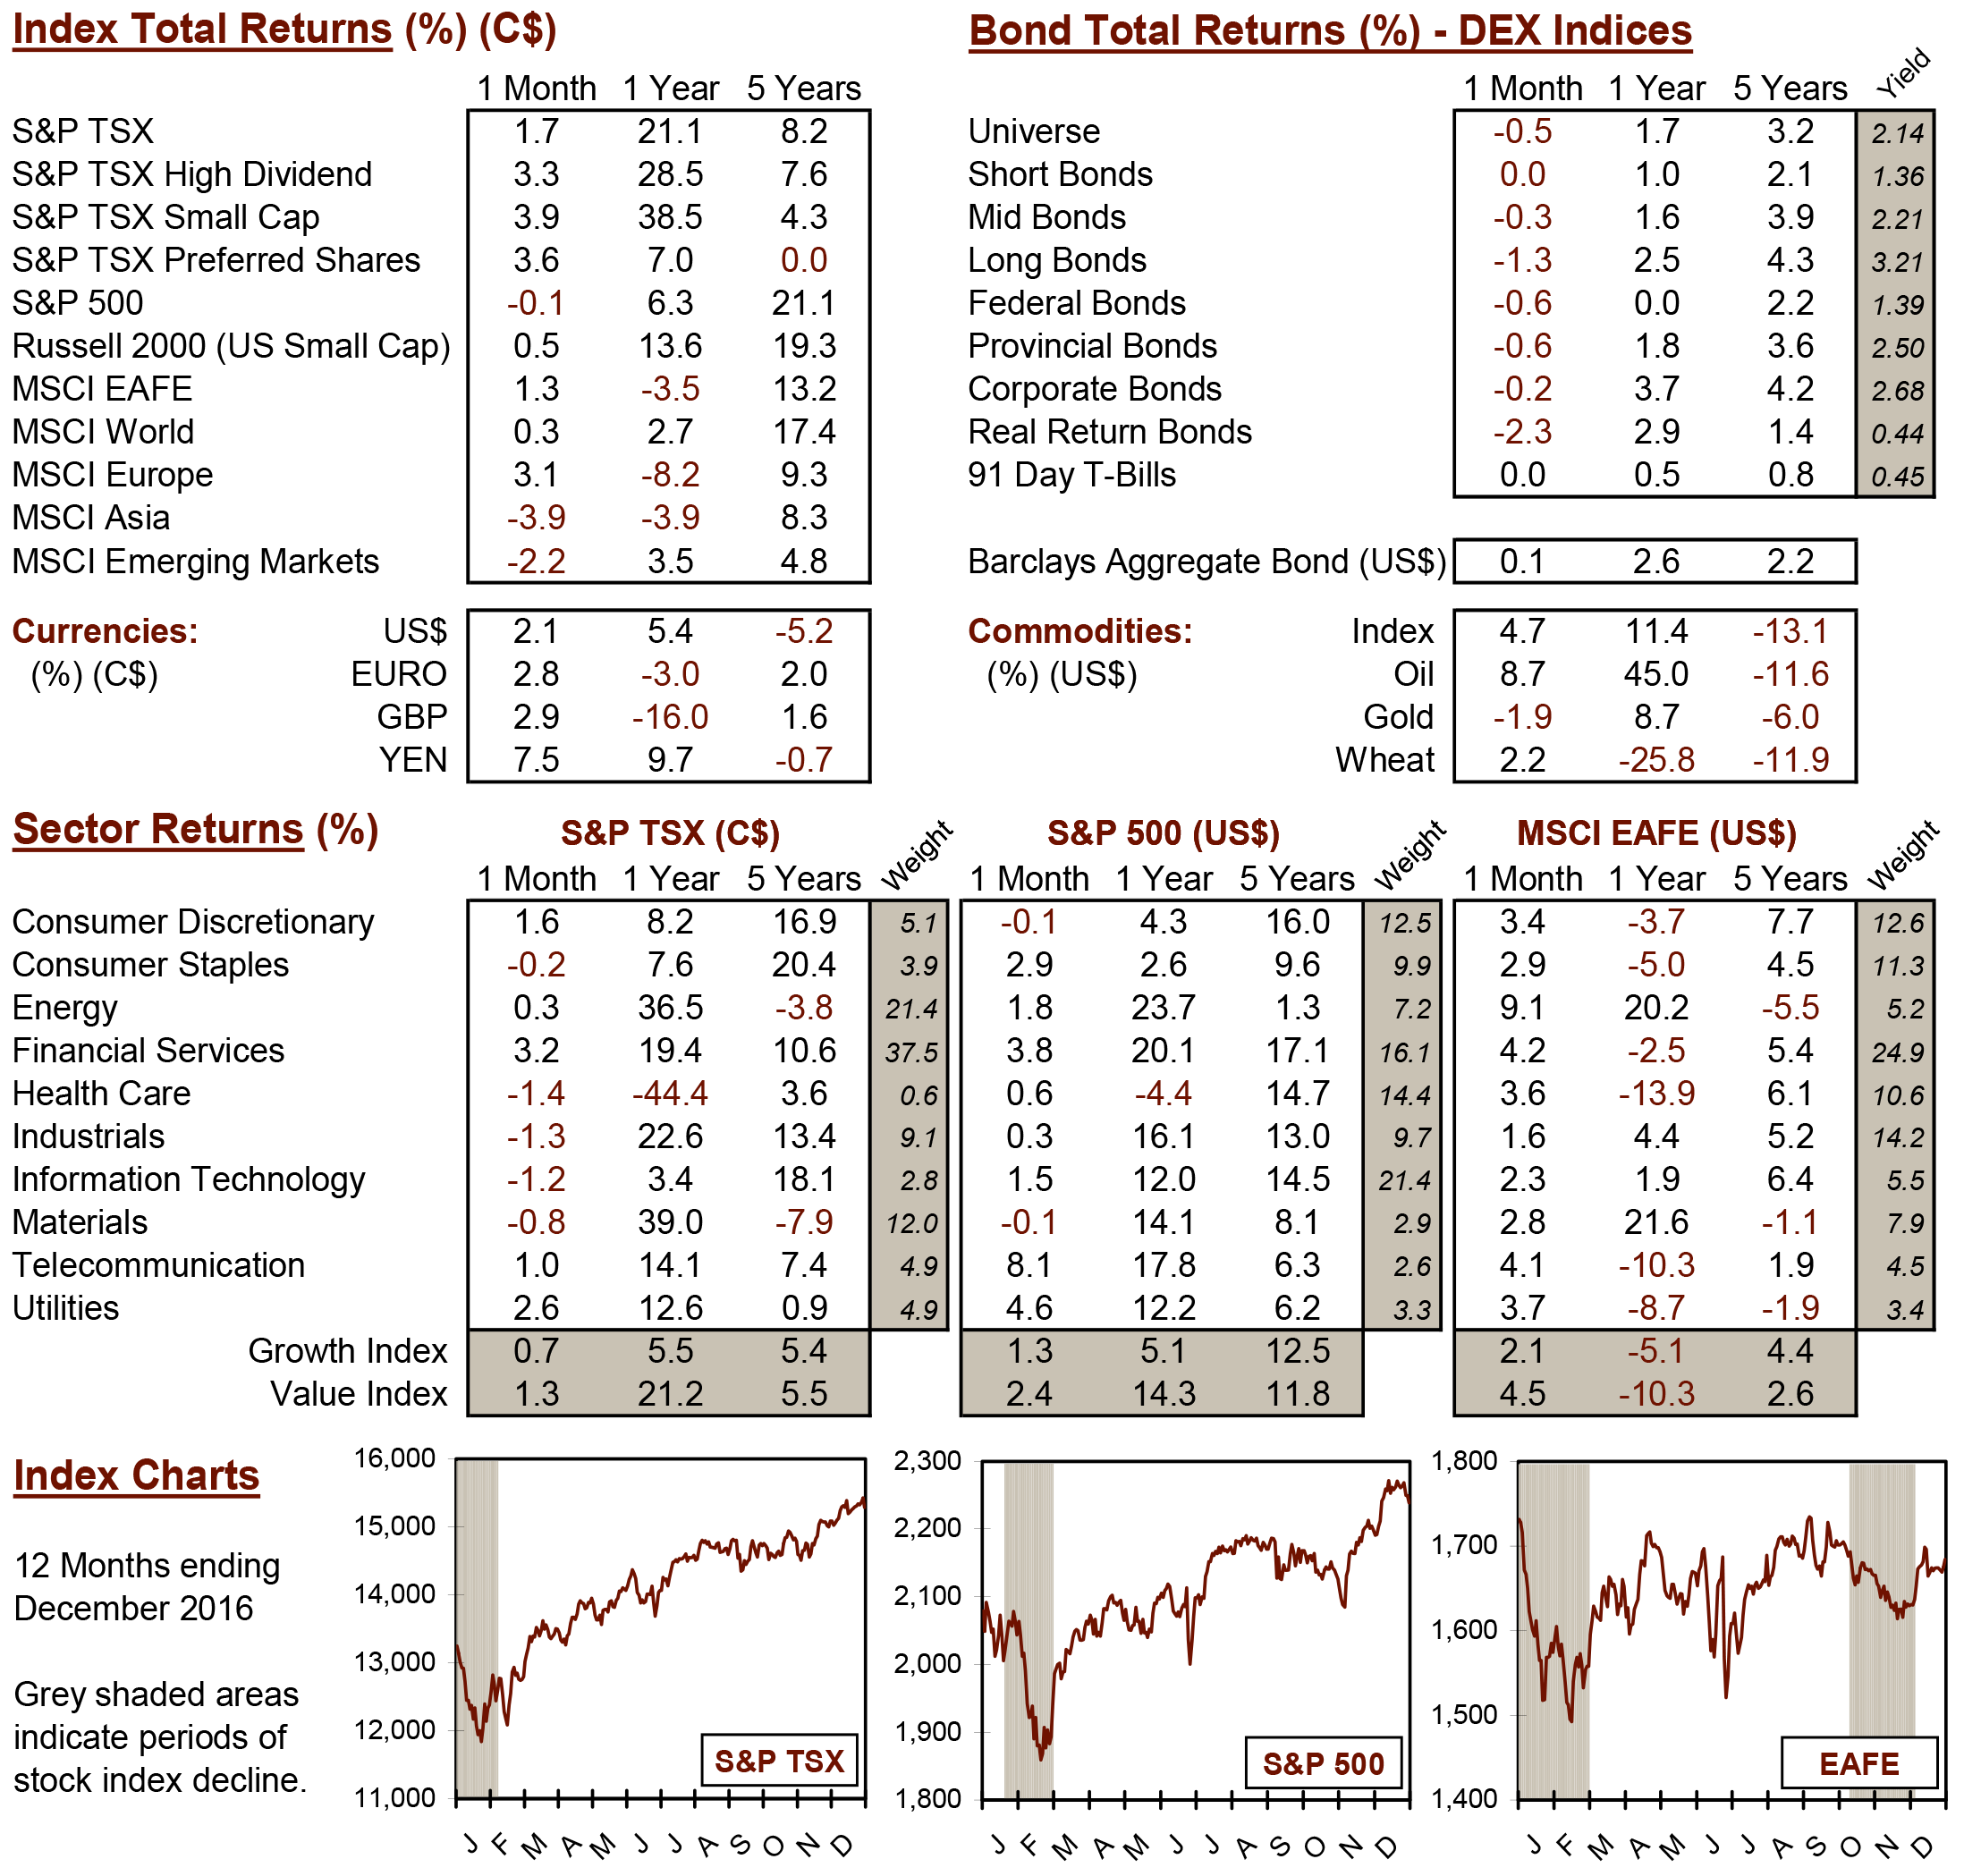
MARKET DATA
This report may contain forward looking statements. Forward looking statements are not guarantees of future performance as actual events and results could differ materially from those expressed or implied. The information in this publication does not constitute investment advice by Provisus Wealth Management Limited and is provided for informational purposes only and therefore is not an offer to buy or sell securities. Past performance may not be indicative of future results. While every effort has been made to ensure the correctness of the numbers and data presented, Provisus Wealth Management does not warrant the accuracy of the data in this publication. This publication is for informational purposes only.
Contact Us
18 King St. East Suite 303
Toronto, ON
M5C 1C4