Knowledge Centre
Rate Hikes Do Not Mean Doom
August 2022
In theory, rising interest rates spell trouble for stocks, but history confirms that equity market returns have varied significantly following an initial central bank rate hike. This is because not all interest rate hikes are equal. An increase is more meaningful if the starting point is 0.5% as opposed to 5.0%. When 10 year bonds yield 5.0%, then bond yields are viewed as potential replacements for stock returns. However, since 10 year Government of Canada bonds are currently yielding 2.61%; and 1.43% at the start of 2022, the worry is less.
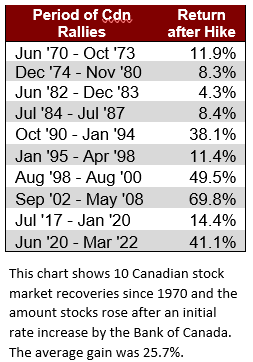
Equity bull markets do not usually end at the first rate hike. Stocks tend to peak much later as can be seen in the table to the left. For the ten Canadian stock market recoveries since 1970, stocks continued to gain 25.7% on average for 12 months. This is split into two distinct periods: 1970 to 1989, when stocks gained 8.2% on average before peaking 5 months after the first hike; and 1990 to 2022, when stocks gained 37.4% on average before peaking 20 months after the first hike.
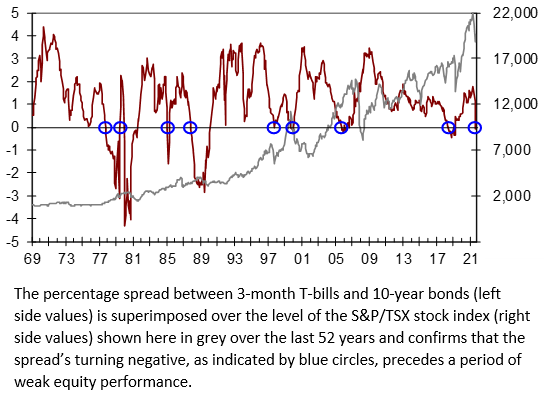
Twitchy investors should look beyond rate hikes and focus on the yield curve. The yield curve is one of the most reliable economic indicators and one that savvy market watchers keep on their radar. Most other economic data is backwards looking so it is no wonder that the track records of forecasters using other signals are abysmal. The yield curve has an excellent record of predicting stock market peaks over the past 52 years and it is just now barely signaling a potential bear market due to the Bank of Canada’s extremely aggressive rate hikes to combat inflation. A yield curve inversion usually takes place about 12 months before the start of a recession but the lead time ranges from about 5 to 16 months. The peak in the stock market usually occurs near the time of the yield curve inversion and just ahead of a recession.
The yield curve describes the difference between short term Canadian cash yields and long term bond yields. Typically, short term interest rates are lower than long term rates, so the yield curve slopes upwards, reflecting higher yields for longer term investments. This is referred to as a normal yield curve. A clear sign that a slowdown is likely is when short rates move above long-term rates and the curve becomes inverted. An inverted yield curve often incites fear in equity markets.
The yield spread between 3 month Treasury bills (T-Bills) and 10 year Canada bonds is shown in the chart above for the past 52 years, including points of inversion as indicated by the blue circles. The grey line in the chart shows the S&P/TSX stock index for ease of comparison. If the Bank of Canada aggressively continues to hike its key policy rate and short term yields rise swiftly, the central bank could certainly trigger a recession but that is not guaranteed to occur at this point.
An inverted yield curve is the best indicator of pending stock market trouble. Rates are usually increased to cool an overheating economy but in the current situation an increase would simply be the normal process of raising rates from historically low levels. Based on what the yield curve is currently telling investors, this market has more room to run and recover the year to date losses (which have been restrained versus past corrections) because a bear market will likely not come until the yield curve says so.
MARKET DATA
This report may contain forward looking statements. Forward looking statements are not guarantees of future performance as actual events and results could differ materially from those expressed or implied. The information in this publication does not constitute investment advice by Provisus Wealth Management Limited and is provided for informational purposes only and therefore is not an offer to buy or sell securities. Past performance may not be indicative of future results. While every effort has been made to ensure the correctness of the numbers and data presented, Provisus Wealth Management does not warrant the accuracy of the data in this publication. This publication is for informational purposes only.
Contact Us
18 King St. East Suite 303
Toronto, ON
M5C 1C4