Knowledge Centre
Quick Plunges / Sharp Rebounds
December 2020
Dramatic and sudden declines in stock markets are rare and can be painful initially. These situations are often the final straw for quite a few investors who decide it is time to throw in the towel and head for the sidelines. However, investors should keep in mind that the onset of most bear markets is not the result of sudden sharp drops but is realized by the steady onslaught of one thing after another or in other words, a death by a thousand cuts. The Canadian stock markets’ abrupt decline in March/April 2020 was not a major bottoming; it was probably the start of something very, very good.
The tsunami of negative sentiment that engulfed the stock market earlier this year was almost palpable. No matter which way you turned, the common worry was, “Oh no! Here we go again.” While the majority is not always incorrect, it is less likely that group think is accurate when it comes to the stock market. When everybody thinks alike, everyone is likely to be wrong. Contrarians exist because they see things differently; they peel back the layers of conventional wisdom and look for reasons to disagree. Often what they uncover becomes very profitable for investors who stray from the herd.
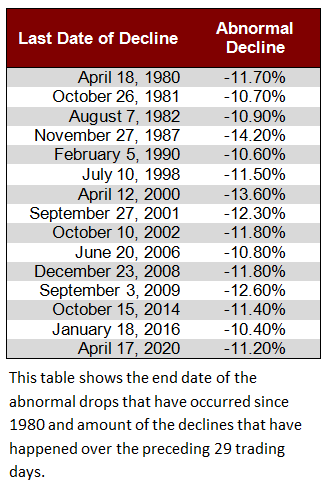
History, as is often the case, provides answers when trying to decipher the impact of sharp drops in the stock market. For the purposes of this analysis we examined the historic data for the S&P/TSX stock index since 1980 and determined the rate of change for the stock market over rolling 29 day trading periods (excluding the impact of dividends). The stock market generated an average rolling 29 day return of 0.8% with a standard deviation (a measure of volatility) of 5.6% over the past 40 years. To uncover the extreme actions of the stock market we looked for 2 standard deviation events or when the stock market declined by 10.3% (0.8% minus 2 times 5.6%) and more. While this occurred quite a few times, particularly in years of significant declines (1981, 1987, 2001, 2008, 2016 and of course 2020), we only incorporated the final day of the abnormal decline for the purposes of this analysis. The 15 days that comprise the dates of these abnormal drops occurred are listed to the left.
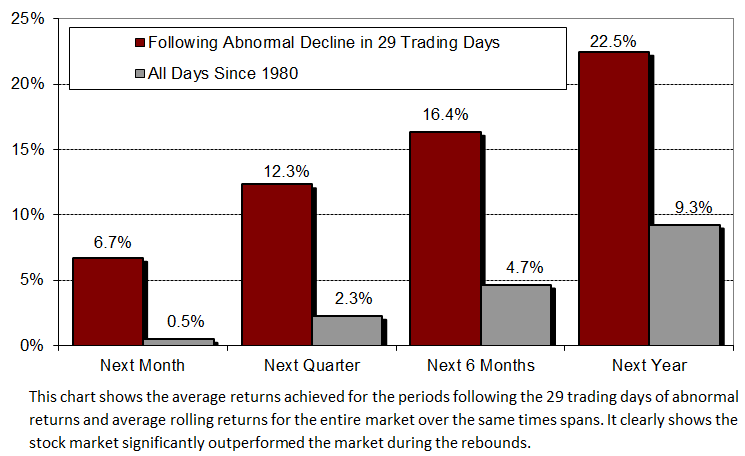
Using these dates as the starting point to discover what happened in subsequent periods, we can observe a truly different outcome than what would have been expected if the pessimism of the sharp drops was extrapolated forward. As the chart to the right shows, during the first month after the abnormally sharp decline occurs the stock market bounces back 6.7% versus the average rolling monthly return for the entire market of 0.5%. This trend of impressively sharp stock market rebounds continued through the next 3 months, 6 months and 1 year periods. The recovering stock market not only recouped its losses after 3 months but it significantly outperformed the market as a whole during the entire recovery phase.
Interestingly, the current rebound in 2020 is basically in line with the long term numbers, indicating the stock market should likely continue to significantly rebound after the recent sharp plunge. These results show that there is something genuinely worthwhile in contrarian analysis and that looking through the prevailing sentiment whether it is bullish or bearish can be a very rewarding endeavor.
MARKET DATA
This report may contain forward looking statements. Forward looking statements are not guarantees of future performance as actual events and results could differ materially from those expressed or implied. The information in this publication does not constitute investment advice by Provisus Wealth Management Limited and is provided for informational purposes only and therefore is not an offer to buy or sell securities. Past performance may not be indicative of future results. While every effort has been made to ensure the correctness of the numbers and data presented, Provisus Wealth Management does not warrant the accuracy of the data in this publication. This publication is for informational purposes only.
Contact Us
18 King St. East Suite 303
Toronto, ON
M5C 1C4