Knowledge Centre
Peak Volatility
October 2018
Traditionally the month of October has been a time to fasten your seat belt because volatility is higher in October than in any other month. Of course, everything from the escalating trade war and rising interest rates to political turmoil will have a say in the results, but from a purely historic performance perspective, equity investors should prepare themselves for a wild ride in the coming weeks. October is one of only three months in Canada since 1968 that has averaged negative monthly performance. June and September are the other two with September holding the dubious distinction of being the worst month – so escaping this September with only a minor loss (which occurred in the closing days of the month on trade fears) was a major feat but October remains as a month in which to exercise caution.
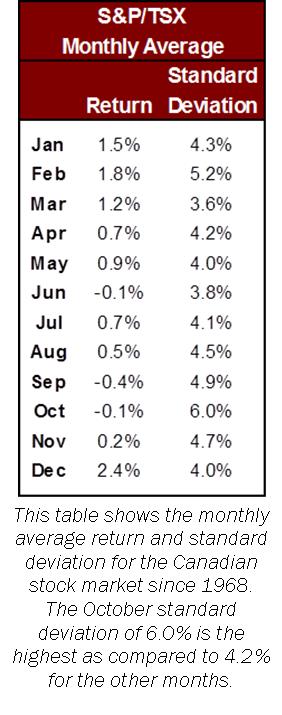
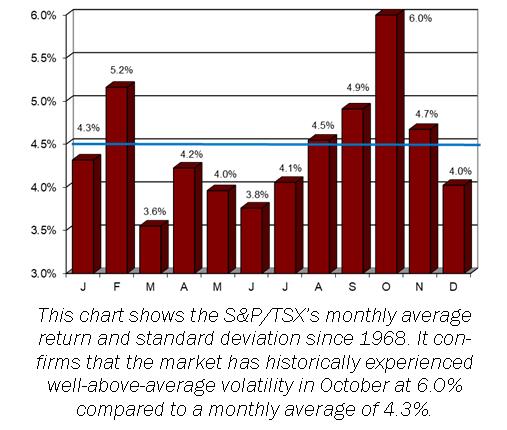
As can be seen in the chart below and the data to the left, the Canadian stock market historically has experienced well-above-average volatility in October. The difference is quite significant, as judged by the measure of volatility known as standard deviation. For all of the Octobers since 1968, the standard deviation of the S&P/TSX’s monthly changes has been 6.0%. That compares to 4.2% for all the months other than October. Of course, most investors will remember several major outliers, such as the October 1987 crash when the market dropped 22.6% or 2008 when the S&P/TSX suffered a 16.9% decline as it reacted to the snowballing financial crisis. This does not even include the more than 80% plunge that occurred on October 29, 1929 that triggered the Great Depression. Investors might think that those few anomalies are the root cause of the volatility; however that would be wrong because even if we eliminate these years from the sample October would still be one of the most volatile months of the year.
There are many theories as to why this occurs. One suggests that after a summer vacation, many stock market analysts and traders return after Labour Day and begin to make major trades which cause an uptick in volatility that spikes in October. Another theory suggests that the volatility is influenced by the Canadian and U.S. Governments as their fiscal years begin on October 1. A third theory suggests that it is simply a reflection of companies reporting their 3rd quarter returns. While it’s difficult to be certain what causes the rise in volatility in October, one thing that is certain is that October gives way to what is historically the best four months of stock performance in Canada which are the months of December through March. Furthermore the months between December up to and including April have generated an average return of 7.6% versus 1.7% for the remaining months of the year.
So investors should not be in a rush to sell down their portfolios, particularly given the fact that in the U.S. for example there have been 35 bull markets since 1900 and 8 have begun in October. That is twice as many as began in any of the other eleven months of the calendar. Interestingly enough there have also been 35 bear markets in the U.S. over the same time span and only one has begun in October, which is well below what one would expect from pure randomness.
Excess volatility tends to ebb and flow. While some periods of high volatility are persistent and occur with apparent regularity this offers little consolation to investors for whom volatility often means portfolio losses. However, for longer-term investors, the investment implication is not to get spooked by October’s volatility and to see past it.
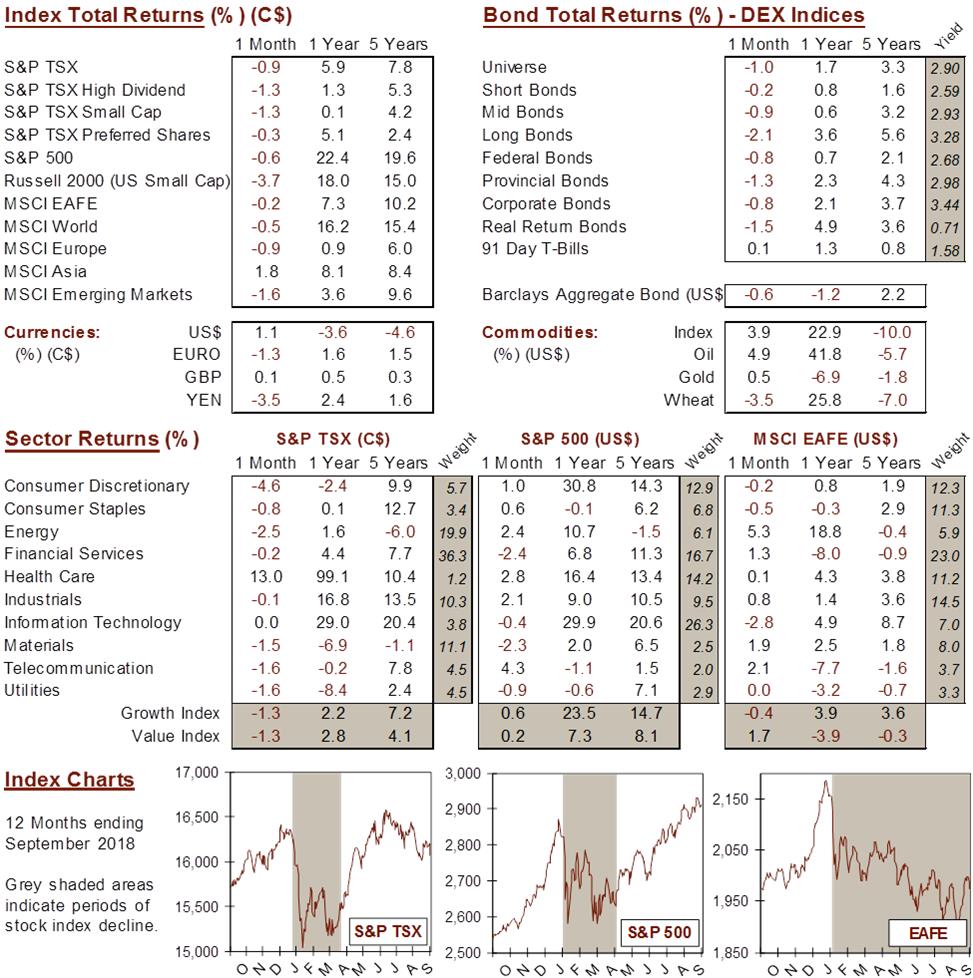
MARKET DATA
This report may contain forward looking statements. Forward looking statements are not guarantees of future performance as actual events and results could differ materially from those expressed or implied. The information in this publication does not constitute investment advice by Provisus Wealth Management Limited and is provided for informational purposes only and therefore is not an offer to buy or sell securities. Past performance may not be indicative of future results. While every effort has been made to ensure the correctness of the numbers and data presented, Provisus Wealth Management does not warrant the accuracy of the data in this publication. This publication is for informational purposes only.
Contact Us
18 King St. East Suite 303
Toronto, ON
M5C 1C4