Knowledge Centre
It’s Been A Drag
March 2021
Since 2013, the Canadian stock market has been in a major funk when compared to the U.S. stock market. Relative performance comparisons have been just plain ugly. This is extremely abnormal because for the 43 years prior to this the two markets have essentially moved in lock step. Sure, there have been short periods of divergence but over the long term the results were highly comparable. From 1970 to 2013, Canadian stocks have produced average annual returns of 10.7% versus the U.S. stock market’s 11.3% per year (all figures in Canadian dollar terms). However, during the last seven years Canadian stocks have returned only 8.1% versus the U.S. stock market’s 20.0% per year.

This divergence was essentially triggered by events that took place on June 11, 2014. Members of OPEC announced that they would not cut their oil production in the face of surging supply. The ensuing 50% drop in oil prices created havoc for Canada, a country dependent upon oil for 10% of its GDP and about a quarter of its exports; as well as the Energy sector which is a major destination for capital investment. This sparked significant harm to the Canadian stock market and has had long lasting repercussions.
The stock market’s sharp divergence was not attributed simply to oil stocks but permeated across all stock sectors because the energy sector plays a much larger role in the stock market than in the economy. Energy stocks account for about 9% of profits, while financial stocks (which have become increasing tied to the expanding resource sectors) account for about 25% of profits in Canada. This duopoly sits at the apex of Canada’s profit pyramid, accounting for 57% of total net income of the 1,000 listed companies (as some of the 1,000 companies reported losses) and dominates the S&P/TSX.
Basically, every class of stocks have gained over the past few years except energy stocks which have taken a beating. Due to the collapse in oil prices; frustrations around pipelines; climate change warriors’ wrath and market access weakening global economic activity, Canadian stock results have been incredibly dire. However, this may be changing and we could be in the initial stages of dramatic reversal, which bodes well not only for energy stocks but the Canadian stock market as a whole.
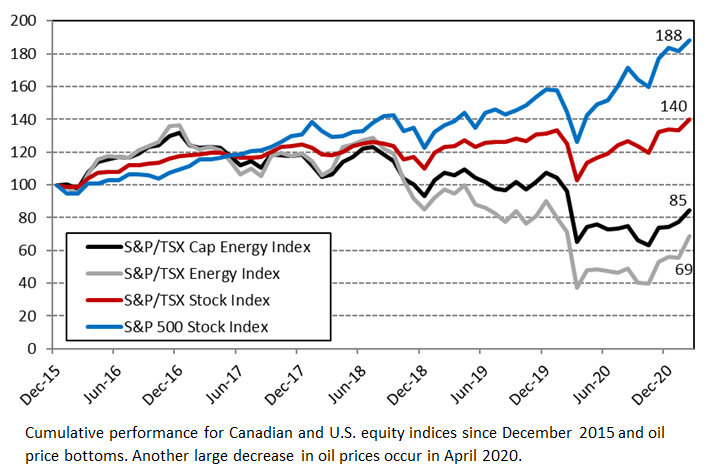
The accompanying chart shows the cumulative results since December 2015 for the S&P 500 Stock Index, the S&P/TSX Stock Index, the S&P/TSX Cap Energy Index (the largest energy stocks in Canada, currently consisting of 14 stocks) and the more broadly based S&P/TSX Energy Index; which was close to the oil price bottom triggered by the OPEC decision. As this chart shows, all four indices are relatively closely bunched until June 2018 as oil prices gradually pared their previous losses and reached a four-year high. At that point, oil prices started another decent into unprecedented new lows; culminating in an absolute feeding-frenzy in April 2020 (coinciding with the most pessimistic COVID-19 induced stock market malaise). Since this bottom the markets have been in an upswing: the S&P 500 Stock Index has gained 48.9%; the S&P/TSX Stock Index has climbed 36.0%, the S&P/TSX Cap Energy Index grew 29.1% and the S&P/TSX Energy Index has surged 85.4%.
While the past several years have been very traumatic for energy stock prices, the companies themselves have not been sitting idly by; they have been working hard to be ready for the day oil prices rise. Companies have hacked away at their expenses and significantly lowered their breakeven points; the currently approved pipeline expansions are moving closer to completion which will dramatically reduce shipping constraints; competing supplies from Mexico and Venezuela are falling; and the sector has seen a flurry of mergers recently which will lead to further efficiencies. So, while the overall health of the oil industry could be concerning, the reality might just turn out to be very different. By extension the Canadian stock market could be on the ground floor of a very rewarding assent.
MARKET DATA
This report may contain forward looking statements. Forward looking statements are not guarantees of future performance as actual events and results could differ materially from those expressed or implied. The information in this publication does not constitute investment advice by Provisus Wealth Management Limited and is provided for informational purposes only and therefore is not an offer to buy or sell securities. Past performance may not be indicative of future results. While every effort has been made to ensure the correctness of the numbers and data presented, Provisus Wealth Management does not warrant the accuracy of the data in this publication. This publication is for informational purposes only.
Contact Us
18 King St. East Suite 303
Toronto, ON
M5C 1C4