Knowledge Centre
From Worst to Best
July 2020
The financial markets have been on a rollercoaster ride over the past six months. However, the net result of all this turbulence is not overly destructive as the following year-to-date performance data shows (all figures are in Canadian dollar terms): S&P/TSX Canadian stock index is down 7.5%; international stocks are only down 6.0%; and U.S. stocks as represented by the S&P 500 are actually up 1.9% so far this year.
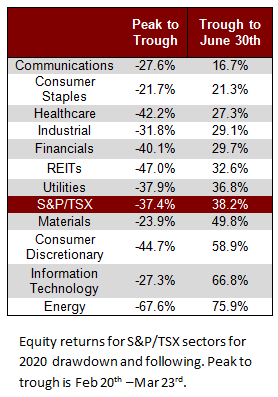
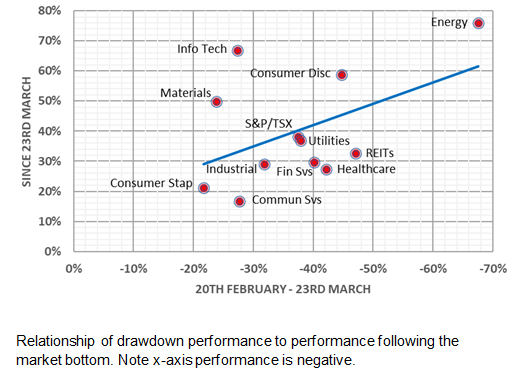
Of course, just as not all stock markets have performed equally, specific categories or sectors have behaved quite differently during times of crisis. This is particularly evident when comparing the results of the major Canadian stock sectors, both during the time of the stock market crash (the peak to trough (market bottom) period of February 20th to March 23rd) and the recovery (from the trough on March 23rd to today, June 30th). Although it is a bit of a broad generalization, the fact remains that the worst performing sectors as the market fell from its peak have become the best performing since the bottom.
The sectors in the Canadian stock market that suffered the most at the start of the COVID-19 crisis are now leading the recovery and the experience of past crises would suggest that this could continue for a while. The past two major market corrections had the same results; with the worst performing sectors as the market fell in March 2000 to October 2002 and October 2007 to March 2009 becoming the best performers in the first six months of each subsequent recovery. As history suggests, the revival of the hardest hit stocks could continue into the coming months since we are currently only a little over three months from the market bottom.
There was a very large performance discrepancy between various sectors of the Canadian stock market that occurred when investors started to worry about COVID-19. This represents a logical response to the unusual economic conditions of the virus-induced lockdowns. The most enduring sectors not surprisingly included Gold, Consumer Staples, and Telecom Services. Energy, Real Estate Income Trusts (REITS) and Consumer Discretionary were among the worst performers as demand for these products and services effectively dried up. Reflecting upon this, the differences between the most and least affected sectors became a chasm as highlighted in the accompanying chart to the right and table to the left.
The pattern described above is now reversing as the world’s largest economies tentatively edge toward re-opening. Obviously, this preliminary recovery in stock prices is not yet complete (i.e. it takes a 100% rise to offset a 50% fall, for example, but only an 11% gain to cancel out a 10% drop) so the hardest hit sectors still have a meaningful way to go to recoup all that was lost. In fact, only three sectors have effectively recovered all they had lost: Consumer Staples, Materials and Information Technology.
This phenomenon is very similar to what has happened during and after past crises. The global financial crisis of 2008 hammered banks, other financials and real estate yet they outperformed for a long time after the market as a whole started to recover. The technology sector was the biggest victim of the dot com collapse yet also led the recovery in the months after the S&P/TSX began to rise back in 2002.
The obvious caveat to this phenomenon continuing is that it all depends on the market broadly continuing to rise. Any renewed pessimism about progress in containing COVID-19 could see the same sectors suffer the most again. Still, as stocks have migrated from worst to best, it has been very rewarding for patient investors.
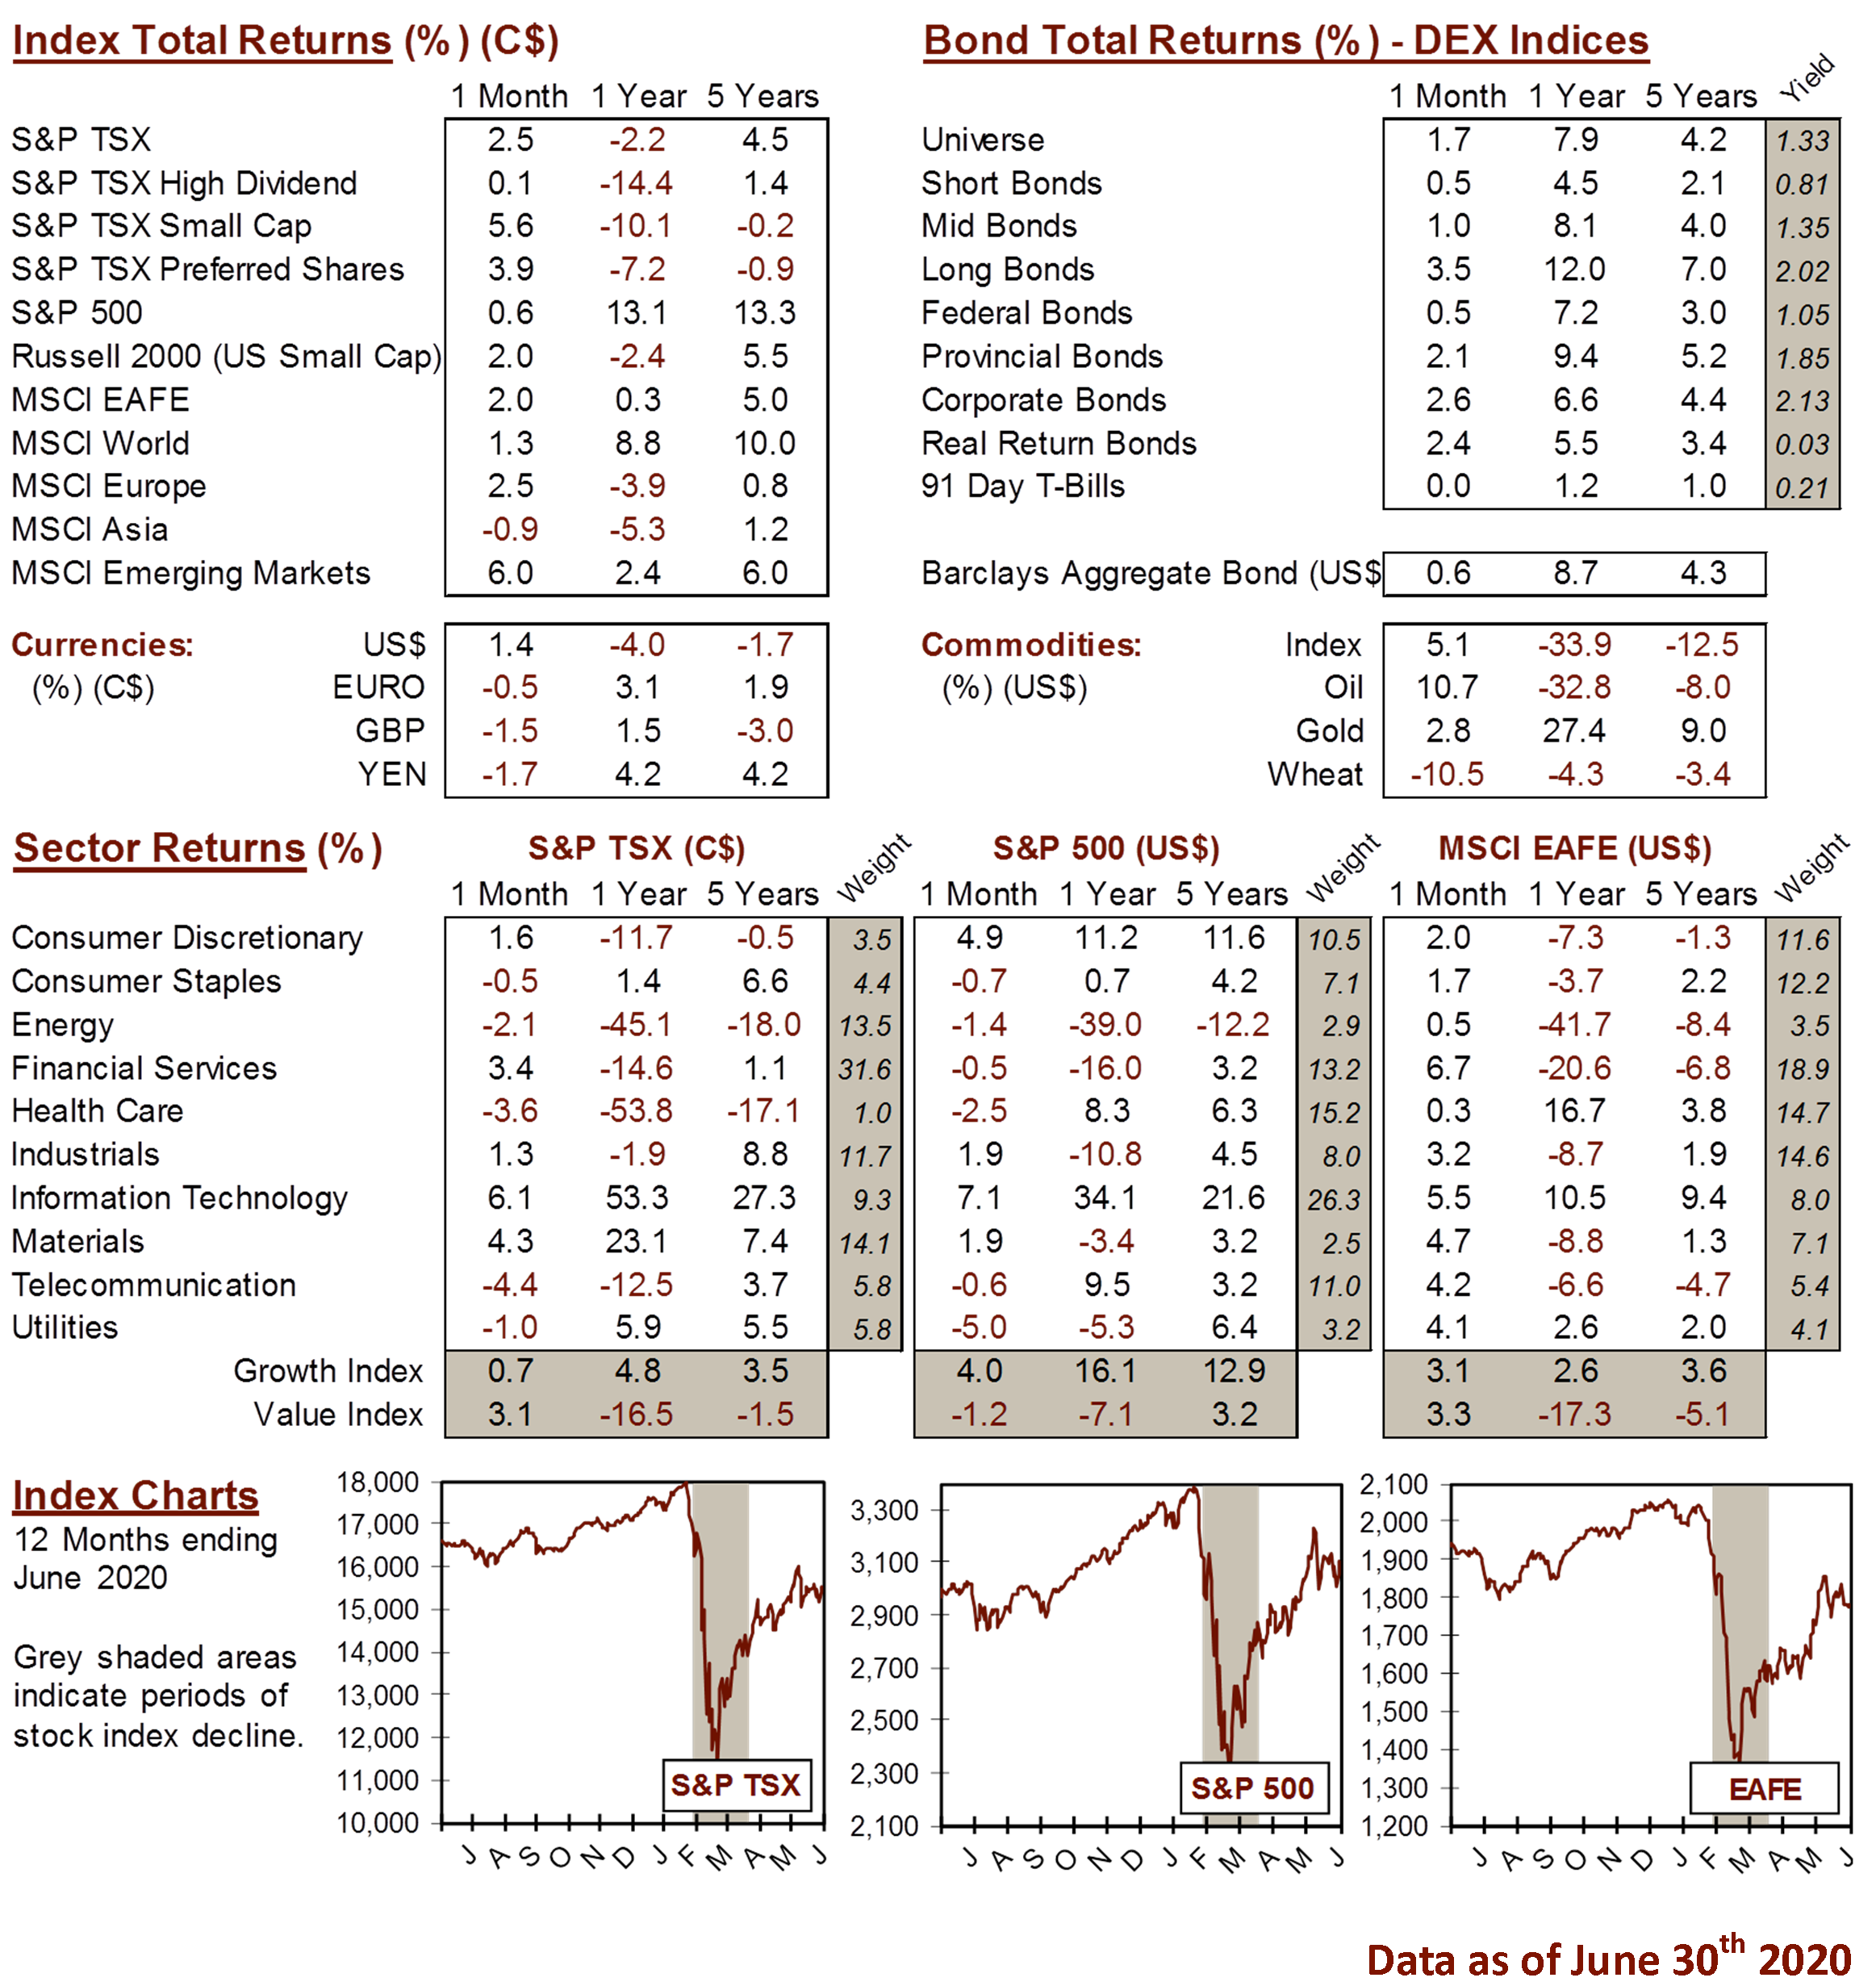
MARKET DATA
This report may contain forward looking statements. Forward looking statements are not guarantees of future performance as actual events and results could differ materially from those expressed or implied. The information in this publication does not constitute investment advice by Provisus Wealth Management Limited and is provided for informational purposes only and therefore is not an offer to buy or sell securities. Past performance may not be indicative of future results. While every effort has been made to ensure the correctness of the numbers and data presented, Provisus Wealth Management does not warrant the accuracy of the data in this publication. This publication is for informational purposes only.
Contact Us
18 King St. East Suite 303
Toronto, ON
M5C 1C4