Knowledge Centre
Escape Velocity
March 2016
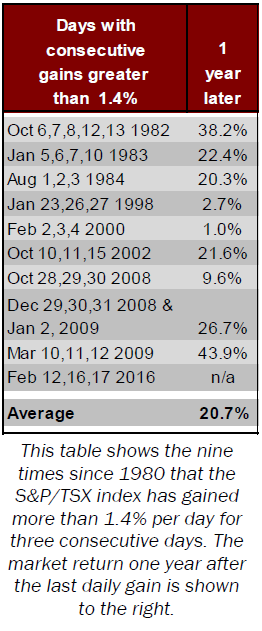
Something very rare occurred on February the 12th, 16th and 17th as the S&P/TSX stock market index gained more than 1.4% per day for three consecutive days. Since 1980 this has only happened nine other times. The interesting aspect is that it has historically triggered an extraordinarily large surge in the value of stock prices in each instance a year later. Obviously kickoff rallies like these are not the only force pushing up stock prices but this pattern is particularly compelling.
Different triggers work better in different situations. In the case of physics, escape velocity is a term that describes the minimum speed needed for an object to break free from the gravitational forces of a massive body. Unfortunately, there is no foolproof means of determining what is needed to propel stocks out of a downward spiral or holding pattern.
Regardless of the S&P/TSX index’s future path, history suggests that as the stock market moves through its various stages, this trigger is worth heeding. At the initial stage of any market recovery, the first step to break a prolonged downtrend or sideways meandering is to form a base. Eventual sellers lose power and buyers become more aggressive. Once an upward trend is launched, more and more investors jump back into the market, even if the fundamentals are bad and the outlook is negative.
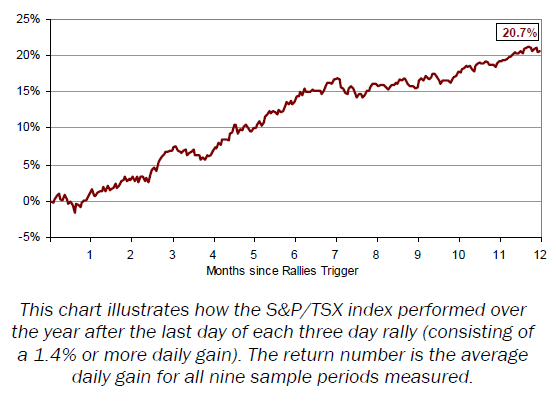
The chart to the right shows how the S&P/TSX index performed one year after the last day with a 1.4% gain. The return in the chart shows the average daily gains for all nine sample periods measured. The table to the left lists each occurrence along with the return one year after the last daily gain. Clearly a 20.7% annual return is very impressive, especially since the average annual return for the S&P/TSX index since 1980 is 9.9%.
As compelling as this historic pattern may be, tunnel vision is an extravagance investors can ill afford. The scope of the potential market rally is far from being clear. Identifying a rally’s starting point is both an art and a science and any number of causes can set it off. For soothsayers, astrologers and stock market chartists, predicting the market's future from past patterns is a very human pursuit. Investors sometimes see things that are not really there and just because something happened a certain way in the past, does not mean it will in the future. Conversely, some patterns do tell us something about the future. After all, those who cannot remember the past are condemned to repeat it and those who study market history have the opportunity to profit from it.
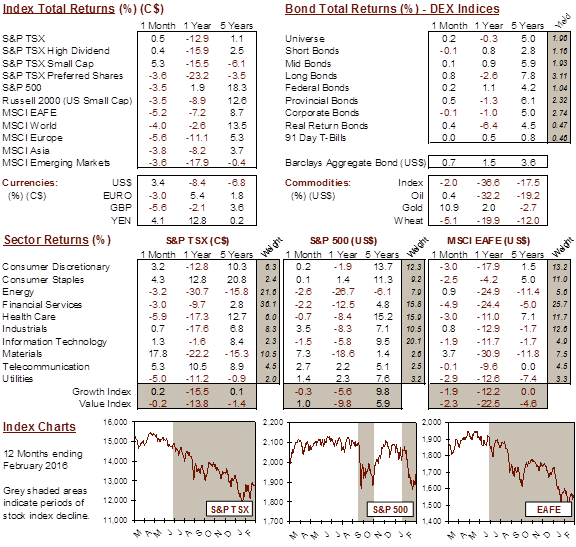
MARKET DATA
This report may contain forward looking statements. Forward looking statements are not guarantees of future performance as actual events and results could differ materially from those expressed or implied. The information in this publication does not constitute investment advice by Provisus Wealth Management Limited and is provided for informational purposes only and therefore is not an offer to buy or sell securities. Past performance may not be indicative of future results. While every effort has been made to ensure the correctness of the numbers and data presented, Provisus Wealth Management does not warrant the accuracy of the data in this publication. This publication is for informational purposes only.
Contact Us
18 King St. East Suite 303
Toronto, ON
M5C 1C4