Knowledge Centre
CHERRY-PICKING
July 2019
Cherry-picking is the practice of presenting the results of a study that best supports your argument, instead of reporting all the findings. If you start with an open mind, that is perfect; however if one sets out to prove what one already believes, you are at the least misinterpreting the evidence. It is also possible that those with good intentions can make a simple error that is sometimes blinded by the same desire to achieve “one’s own truth”. From time to time cherry-picking is done in the investment industry and investors should take the latest headline with “a grain of salt” in some cases.
We recently came across some analysis that, upon first review, appeared to spell inevitable doom for the equity market if the highlighted conclusions actually transpired. We attempted to replicate the analysis (which was being applied to the U.S. stock market) to see if the same case would hold true in Canada. The Canadian and U.S. stock market peaks are fairly uniform so the assumption was that it should not matter which exchange was selected. What actually occurred was just so much fluff, that the only term that came to mind was “Fake News”.
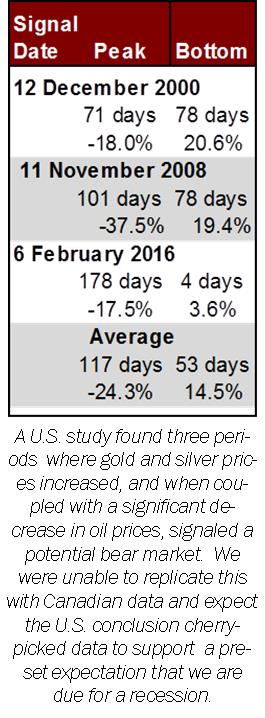
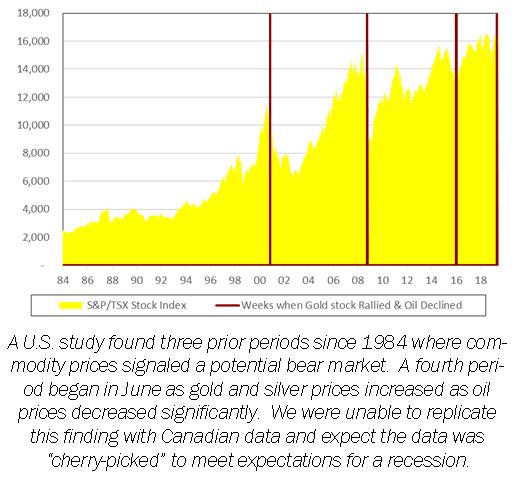
The research was trying to prove the theory that a significant rise in gold prices, when coupled with a significant fall in oil prices, will lead to a bear market. The study identified changes over 5-day rolling week periods when gold and silver stocks (Philadelphia Stock Exchange Gold and Silver Index) rallied at least 5.2% and oil prices (West Texas Intermediate Index) declined by 8.7% on the same day (in U.S. dollar terms). This study determined that there were three distinct periods (chart on the left) where the significant increase in gold and silver coupled with the significant decrease in oil signaled a bear market. However, when we performed the same analysis (at least a 5.2% increase in gold and silver on the same day as at least an 8.7% decrease in oil), we found 28 such signals since the start of 1984 that indicated very little. We were only able to create the three signals when gold and silver stocks gained at least 9.0% and oil price declined at least 11.0%. The signals were really quite uninformative, as the data to the left indicates that the signals occurred on average 117 business days after the market’s peak. You would have already lost an average of -24.3% by then. Of course, the good news is that you would have gotten out of the market 53 days before the bottom and prevented another 14.5% of losses.
Data dredging, data fishing and data snooping are terms that basically mean mining from a larger population of data to find hidden patterns. Any model that gives you great predictions today may be useless tomorrow. Sure, data mining can quickly take the guesswork out of data by looking for automated predictions of behavior, but don’t bet your savings on any one predictive model. If you are using cherry-picked data then there is a pretty good chance that your conclusions may be wrong. Relying on incomplete information can leave you with less than desirable results.
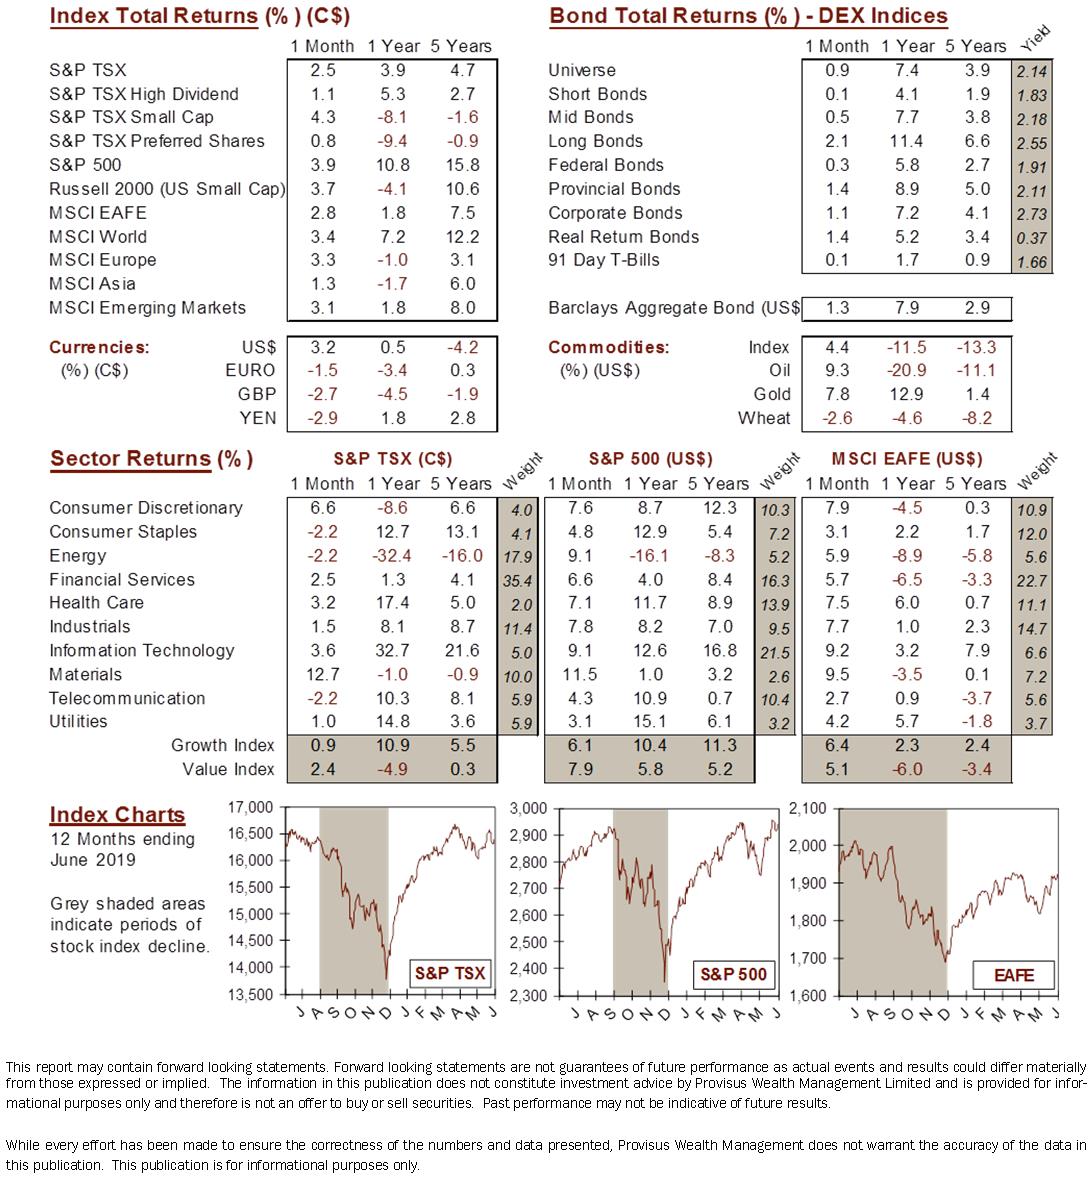
MARKET DATA
This report may contain forward looking statements. Forward looking statements are not guarantees of future performance as actual events and results could differ materially from those expressed or implied. The information in this publication does not constitute investment advice by Provisus Wealth Management Limited and is provided for informational purposes only and therefore is not an offer to buy or sell securities. Past performance may not be indicative of future results. While every effort has been made to ensure the correctness of the numbers and data presented, Provisus Wealth Management does not warrant the accuracy of the data in this publication. This publication is for informational purposes only.
Contact Us
18 King St. East Suite 303
Toronto, ON
M5C 1C4